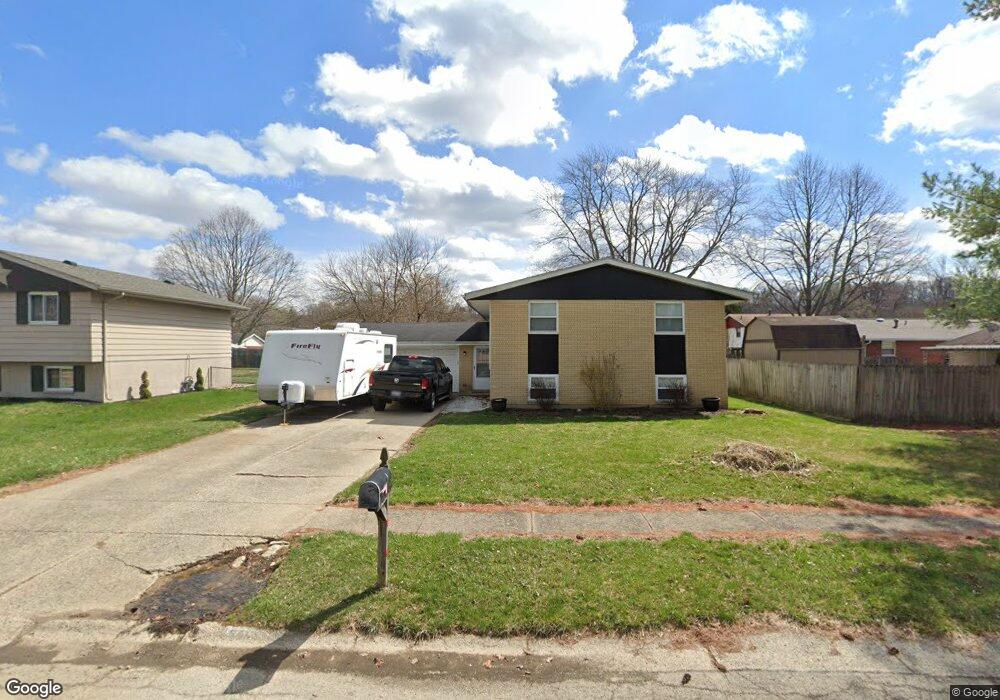
5306 Waverly St Fairborn, OH 45324
Estimated Value: $208,000 - $237,365
3
Beds
2
Baths
1,886
Sq Ft
$117/Sq Ft
Est. Value
About This Home
This home is located at 5306 Waverly St, Fairborn, OH 45324 and is currently estimated at $221,591, approximately $117 per square foot. 5306 Waverly St is a home located in Clark County with nearby schools including Greenon Elementary School, Greenon Jr. High School, and Greenon High School.
Ownership History
Date
Name
Owned For
Owner Type
Purchase Details
Closed on
Feb 10, 2015
Sold by
Fannie Mae
Bought by
Holmes Michael K
Current Estimated Value
Home Financials for this Owner
Home Financials are based on the most recent Mortgage that was taken out on this home.
Original Mortgage
$86,725
Interest Rate
3.77%
Mortgage Type
VA
Purchase Details
Closed on
Feb 24, 2014
Sold by
Cox Jack W
Bought by
Federal National Mortgage Association
Purchase Details
Closed on
Jul 25, 2008
Sold by
Woods Debra A and Woods Gene M
Bought by
Cox Jack W
Home Financials for this Owner
Home Financials are based on the most recent Mortgage that was taken out on this home.
Original Mortgage
$100,000
Interest Rate
6.39%
Mortgage Type
Credit Line Revolving
Purchase Details
Closed on
Jul 16, 2008
Sold by
Jones Richard and Jones Robin
Bought by
Cox Jack W
Home Financials for this Owner
Home Financials are based on the most recent Mortgage that was taken out on this home.
Original Mortgage
$100,000
Interest Rate
6.39%
Mortgage Type
Credit Line Revolving
Create a Home Valuation Report for This Property
The Home Valuation Report is an in-depth analysis detailing your home's value as well as a comparison with similar homes in the area
Home Values in the Area
Average Home Value in this Area
Purchase History
| Date | Buyer | Sale Price | Title Company |
|---|---|---|---|
| Holmes Michael K | -- | Intitle Agency | |
| Federal National Mortgage Association | $43,334 | Attorney | |
| Cox Jack W | $10,000 | Attorney | |
| Cox Jack W | $10,000 | Attorney |
Source: Public Records
Mortgage History
| Date | Status | Borrower | Loan Amount |
|---|---|---|---|
| Previous Owner | Holmes Michael K | $86,725 | |
| Previous Owner | Cox Jack W | $100,000 |
Source: Public Records
Tax History Compared to Growth
Tax History
| Year | Tax Paid | Tax Assessment Tax Assessment Total Assessment is a certain percentage of the fair market value that is determined by local assessors to be the total taxable value of land and additions on the property. | Land | Improvement |
|---|---|---|---|---|
| 2024 | $2,722 | $51,660 | $8,490 | $43,170 |
| 2023 | $2,722 | $51,660 | $8,490 | $43,170 |
| 2022 | $2,719 | $51,660 | $8,490 | $43,170 |
| 2021 | $2,613 | $43,990 | $6,850 | $37,140 |
| 2020 | $2,619 | $43,990 | $6,850 | $37,140 |
| 2019 | $2,655 | $43,990 | $6,850 | $37,140 |
| 2018 | $2,634 | $43,010 | $6,850 | $36,160 |
| 2017 | $2,661 | $44,996 | $6,853 | $38,143 |
| 2016 | $2,321 | $44,996 | $6,853 | $38,143 |
| 2015 | $2,285 | $43,194 | $6,853 | $36,341 |
| 2014 | $1,784 | $43,194 | $6,853 | $36,341 |
| 2013 | $792 | $43,194 | $6,853 | $36,341 |
Source: Public Records
Map
Nearby Homes
- 8111 Wescott Ave
- 5206 Wakefield Dr
- 4772 Pheasanthill Ct
- 7035 Creekside Cir
- 7581 Dayton Springfield Rd
- 8721 Haddix Rd
- 5463 Enon-Xenia Rd
- 1901 Armstrong Rd
- 806 Spring Lake Cir Unit 6
- 6729 Sterling Dr
- 1022 Stoneybrook Trail
- 4538 Cynthia Dr
- 6891 Joseph Dr
- 2113 Wellington Ct
- 3306 Westchester Ct
- 6835 Joseph Dr
- 4441 S Xenia Dr
- 4312 Tamara St
- 1695 Wimbledon Dr
- 579 Woodhaven Trail
- 8020 Wescott Ave
- 8014 Wescott Ave
- 5317 Saum St
- 5309 Saum St
- 5244 Waverly St
- 8008 Wescott Ave
- 5307 Waverly St
- 5313 Waverly St
- 5301 Waverly St
- 5303 Saum St
- 5238 Waverly St
- 5243 Waverly St
- 5249 Saum St
- 8102 Wescott Ave
- 8006 Philadelphia Dr
- 5237 Waverly St
- 5232 Waverly St
- 5260 Melvina St
- 8007 Philadelphia Dr
- 5252 Melvina St