5307 Belmont Ave Dallas, TX 75206
Lower Greenville NeighborhoodEstimated Value: $1,435,000 - $1,794,000
3
Beds
4
Baths
4,031
Sq Ft
$404/Sq Ft
Est. Value
About This Home
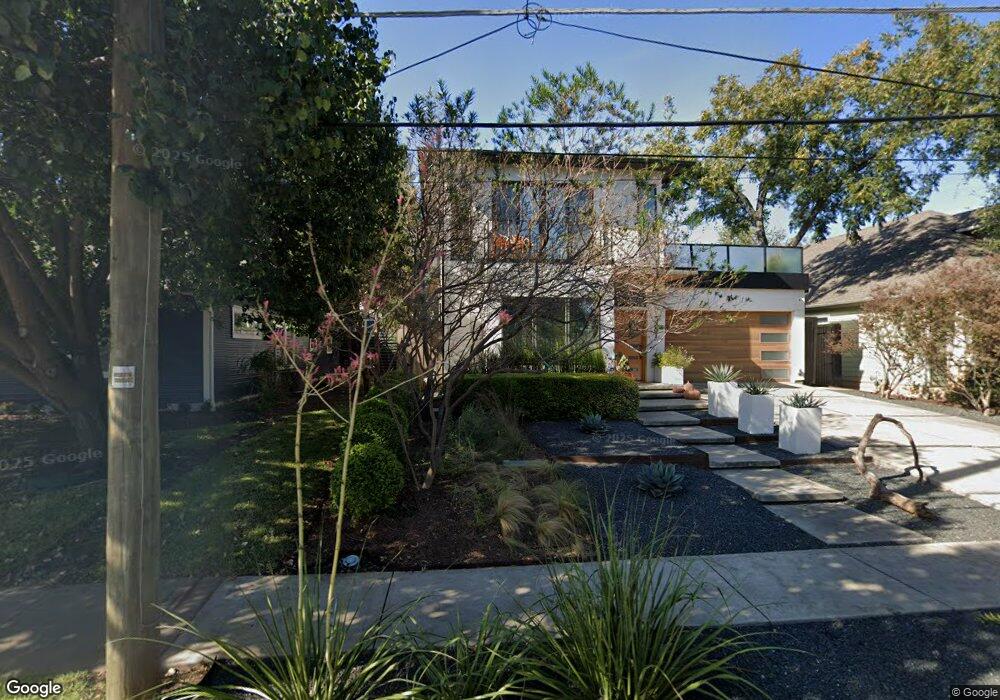
This home is located at 5307 Belmont Ave, Dallas, TX 75206 and is currently estimated at $1,629,354, approximately $404 per square foot. 5307 Belmont Ave is a home located in Dallas County with nearby schools including J L Long Middle School, Woodrow Wilson High School, and The Saint Timothy School.
Ownership History
Date
Name
Owned For
Owner Type
Purchase Details
Closed on
Mar 31, 2017
Sold by
Gtm Investment Llc
Bought by
Fetzer David T and Roth Eira S
Current Estimated Value
Home Financials for this Owner
Home Financials are based on the most recent Mortgage that was taken out on this home.
Original Mortgage
$890,853
Outstanding Balance
$740,307
Interest Rate
4.16%
Mortgage Type
New Conventional
Estimated Equity
$889,047
Purchase Details
Closed on
Jul 22, 2016
Sold by
Gtm Investments Llc
Bought by
Fetzer David and Roth Eira Sofi
Purchase Details
Closed on
Jul 17, 2016
Sold by
Antillon Manuel
Bought by
Gtm Investment Llc
Purchase Details
Closed on
Dec 14, 2015
Sold by
Cowan Gary Walter and Cowan Patricia Kay
Bought by
Antillon Manuel
Purchase Details
Closed on
Aug 6, 1996
Sold by
Frappier James C
Bought by
Bank One Texas Na
Create a Home Valuation Report for This Property
The Home Valuation Report is an in-depth analysis detailing your home's value as well as a comparison with similar homes in the area
Home Values in the Area
Average Home Value in this Area
Purchase History
| Date | Buyer | Sale Price | Title Company |
|---|---|---|---|
| Fetzer David T | -- | Chicago Title | |
| Fetzer David | -- | Chicago Title | |
| Gtm Investment Llc | $260,000 | None Available | |
| Antillon Manuel | -- | Fatco | |
| Bank One Texas Na | $42,500 | -- |
Source: Public Records
Mortgage History
| Date | Status | Borrower | Loan Amount |
|---|---|---|---|
| Open | Fetzer David T | $890,853 |
Source: Public Records
Tax History Compared to Growth
Tax History
| Year | Tax Paid | Tax Assessment Tax Assessment Total Assessment is a certain percentage of the fair market value that is determined by local assessors to be the total taxable value of land and additions on the property. | Land | Improvement |
|---|---|---|---|---|
| 2025 | $19,965 | $1,285,510 | $405,000 | $880,510 |
| 2024 | $19,965 | $1,285,510 | $405,000 | $880,510 |
| 2023 | $19,965 | $1,009,510 | $405,000 | $604,510 |
| 2022 | $25,184 | $1,007,200 | $303,750 | $703,450 |
| 2021 | $25,158 | $953,690 | $270,000 | $683,690 |
| 2020 | $25,426 | $937,230 | $270,000 | $667,230 |
| 2019 | $24,373 | $856,620 | $270,000 | $586,620 |
| 2018 | $20,355 | $856,620 | $270,000 | $586,620 |
| 2017 | $13,979 | $514,060 | $168,750 | $345,310 |
| 2016 | $7,096 | $260,940 | $168,750 | $92,190 |
| 2015 | $4,065 | $183,300 | $118,130 | $65,170 |
| 2014 | $4,065 | $183,300 | $118,130 | $65,170 |
Source: Public Records
Map
Nearby Homes
- 2626 Madera St
- 5231 Manett St
- 5220 Bonita Ave
- 5410 Belmont Ave
- 5335 Richard Ave
- 5419 Richmond Ave
- 5438 Bonita Ave
- 2406 Wild Cherry Way
- 5433 Melrose Ave
- 5448 Bonita Ave
- 5451 Richmond Ave
- 5322 Miller Ave
- 4816 Belmont Ave
- 2623 N Garrett Ave
- 2317 Moser Ave Unit 106
- 5456 Richmond Ave
- 5114 Alcott St
- 2222 Moser Ave Unit 111
- 2222 Moser Ave Unit 115
- 2222 Moser Ave Unit 107
- 5311 Belmont Ave
- 5315 Belmont Ave
- 2514 Madera St
- 5321 Belmont Ave
- 2518 Madera St
- 5308 Belmont Ave
- 5314 Manett St
- 5323 Belmont Ave
- 2522 Madera St
- 5306 Belmont Ave
- 2505 Madera St
- 2501 Madera St
- 5318 Manett St
- 5310 Belmont Ave
- 2511 Madera St
- 5314 Belmont Ave
- 2515 Madera St
- 2423 Madera St
- 5320 Manett St
- 2423 Madera St