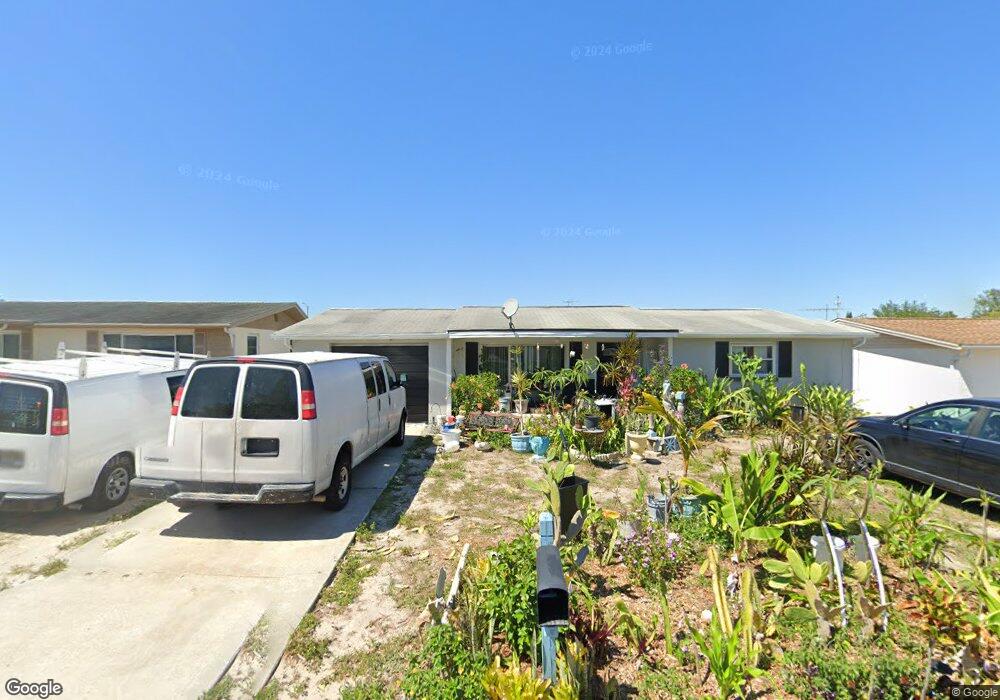
5307 Moog Rd New Port Richey, FL 34652
Estimated Value: $198,134 - $282,000
2
Beds
2
Baths
1,284
Sq Ft
$186/Sq Ft
Est. Value
About This Home
This home is located at 5307 Moog Rd, New Port Richey, FL 34652 and is currently estimated at $238,784, approximately $185 per square foot. 5307 Moog Rd is a home located in Pasco County with nearby schools including Anclote Elementary School, Gulf Middle School, and Gulf High School.
Ownership History
Date
Name
Owned For
Owner Type
Purchase Details
Closed on
Apr 28, 2016
Sold by
County Of Pasco
Bought by
Yacoub Emad
Current Estimated Value
Purchase Details
Closed on
Apr 9, 2005
Sold by
Ingraldi Thomas R and Ingraldi Debra M
Bought by
Ingraldi Thomas R and Ingraldi Debra M
Home Financials for this Owner
Home Financials are based on the most recent Mortgage that was taken out on this home.
Original Mortgage
$118,750
Interest Rate
8.15%
Mortgage Type
Stand Alone Refi Refinance Of Original Loan
Purchase Details
Closed on
Mar 23, 1999
Sold by
Hartmann James W and Hartmann Virginia
Bought by
Ingraldi Thomas R
Home Financials for this Owner
Home Financials are based on the most recent Mortgage that was taken out on this home.
Original Mortgage
$45,435
Interest Rate
6.74%
Mortgage Type
FHA
Create a Home Valuation Report for This Property
The Home Valuation Report is an in-depth analysis detailing your home's value as well as a comparison with similar homes in the area
Home Values in the Area
Average Home Value in this Area
Purchase History
| Date | Buyer | Sale Price | Title Company |
|---|---|---|---|
| Yacoub Emad | $39,000 | None Available | |
| Ingraldi Thomas R | -- | Motions Title | |
| Ingraldi Thomas R | $45,000 | -- |
Source: Public Records
Mortgage History
| Date | Status | Borrower | Loan Amount |
|---|---|---|---|
| Previous Owner | Ingraldi Thomas R | $118,750 | |
| Previous Owner | Ingraldi Thomas R | $3,551 | |
| Previous Owner | Ingraldi Thomas R | $72,212 | |
| Previous Owner | Ingraldi Thomas R | $25,000 | |
| Previous Owner | Ingraldi Thomas R | $45,435 |
Source: Public Records
Tax History Compared to Growth
Tax History
| Year | Tax Paid | Tax Assessment Tax Assessment Total Assessment is a certain percentage of the fair market value that is determined by local assessors to be the total taxable value of land and additions on the property. | Land | Improvement |
|---|---|---|---|---|
| 2025 | $2,747 | $176,194 | $33,966 | $142,228 |
| 2024 | $2,747 | $187,222 | $31,824 | $155,398 |
| 2023 | $2,558 | $114,080 | $0 | $0 |
| 2022 | $1,989 | $130,103 | $21,216 | $108,887 |
| 2021 | $1,819 | $112,706 | $16,830 | $95,876 |
| 2020 | $1,596 | $88,967 | $10,863 | $78,104 |
| 2019 | $1,532 | $89,844 | $10,863 | $78,981 |
| 2018 | $1,375 | $76,074 | $10,863 | $65,211 |
| 2017 | $1,258 | $64,411 | $10,863 | $53,548 |
| 2016 | $1,053 | $55,126 | $10,863 | $44,263 |
| 2015 | $973 | $47,875 | $10,863 | $37,012 |
| 2014 | $880 | $43,735 | $10,200 | $33,535 |
Source: Public Records
Map
Nearby Homes