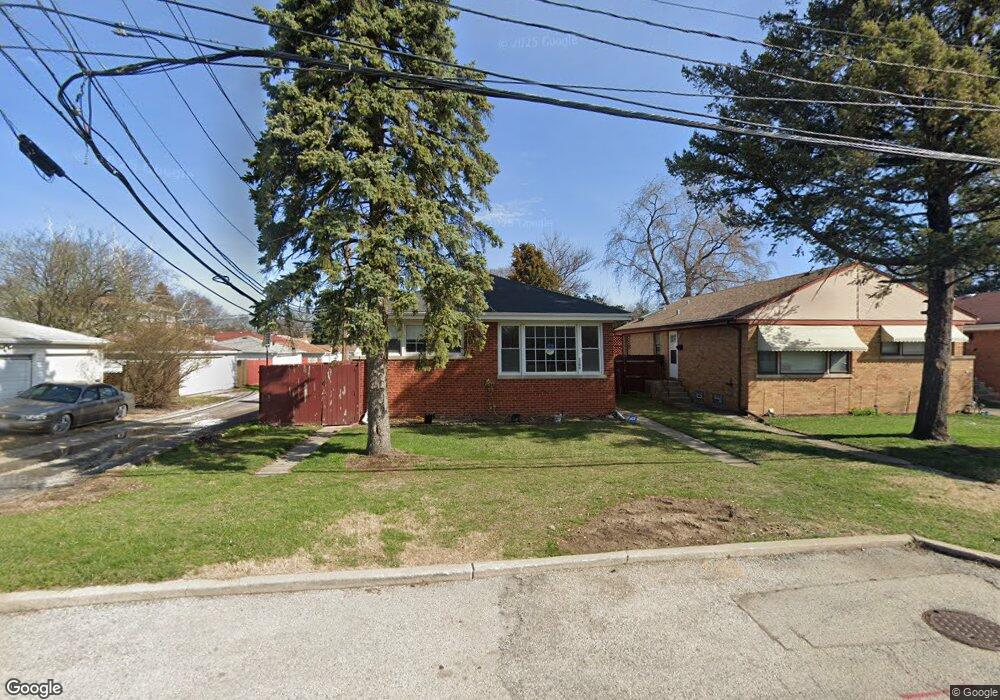
5308 Howard St Skokie, IL 60077
Southwest Skokie NeighborhoodEstimated Value: $362,000 - $446,000
3
Beds
2
Baths
1,092
Sq Ft
$367/Sq Ft
Est. Value
About This Home
This home is located at 5308 Howard St, Skokie, IL 60077 and is currently estimated at $401,158, approximately $367 per square foot. 5308 Howard St is a home located in Cook County with nearby schools including Fairview South Elementary School, Niles West High School, and Cheder Lubavitch Hebrew Day School.
Ownership History
Date
Name
Owned For
Owner Type
Purchase Details
Closed on
Mar 13, 2019
Sold by
Osuji Kelechukwu
Bought by
Osuji Emeka
Current Estimated Value
Purchase Details
Closed on
Oct 15, 2009
Sold by
Chicago Title Land Trust Company
Bought by
Osuji Kelechukwu
Purchase Details
Closed on
Jul 26, 2005
Sold by
Osuji Kelechukwu
Bought by
Chicago Title Land Trust Co and Trust #8002347004
Purchase Details
Closed on
Apr 7, 1997
Sold by
Dossas Anastasia
Bought by
Osuji Kelechukwu
Home Financials for this Owner
Home Financials are based on the most recent Mortgage that was taken out on this home.
Original Mortgage
$127,500
Interest Rate
7.74%
Purchase Details
Closed on
Apr 11, 1996
Sold by
Dossas Odysseus A and Dossas Afroditi
Bought by
Dossas Odyssaus A and Dossas Anastasia
Home Financials for this Owner
Home Financials are based on the most recent Mortgage that was taken out on this home.
Original Mortgage
$95,000
Interest Rate
7.44%
Create a Home Valuation Report for This Property
The Home Valuation Report is an in-depth analysis detailing your home's value as well as a comparison with similar homes in the area
Home Values in the Area
Average Home Value in this Area
Purchase History
| Date | Buyer | Sale Price | Title Company |
|---|---|---|---|
| Osuji Emeka | -- | First American Title Ins Co | |
| Osuji Kelechukwu | -- | Chicago Title Land Trust Co | |
| Chicago Title Land Trust Co | -- | None Available | |
| Osuji Kelechukwu | $170,000 | -- | |
| Dossas Odyssaus A | -- | Chicago Title Insurance Co |
Source: Public Records
Mortgage History
| Date | Status | Borrower | Loan Amount |
|---|---|---|---|
| Previous Owner | Osuji Kelechukwu | $127,500 | |
| Previous Owner | Dossas Odyssaus A | $95,000 |
Source: Public Records
Tax History Compared to Growth
Tax History
| Year | Tax Paid | Tax Assessment Tax Assessment Total Assessment is a certain percentage of the fair market value that is determined by local assessors to be the total taxable value of land and additions on the property. | Land | Improvement |
|---|---|---|---|---|
| 2024 | $6,616 | $31,292 | $7,410 | $23,882 |
| 2023 | $6,397 | $31,292 | $7,410 | $23,882 |
| 2022 | $6,397 | $31,292 | $7,410 | $23,882 |
| 2021 | $5,328 | $23,868 | $4,560 | $19,308 |
| 2020 | $5,424 | $24,992 | $4,560 | $20,432 |
| 2019 | $5,598 | $28,081 | $4,560 | $23,521 |
| 2018 | $4,290 | $20,414 | $4,132 | $16,282 |
| 2017 | $4,346 | $20,414 | $4,132 | $16,282 |
| 2016 | $4,786 | $22,259 | $4,132 | $18,127 |
| 2015 | $3,846 | $17,355 | $3,562 | $13,793 |
| 2014 | $4,081 | $18,740 | $3,562 | $15,178 |
| 2013 | $4,250 | $19,210 | $3,562 | $15,648 |
Source: Public Records
Map
Nearby Homes
- 7507 Frontage Rd
- 5153 Dobson St
- 7500 Laramie Ave
- 5261 Mulford St
- 5500 Harvard Terrace
- 5501 Mulford St
- 5251 Galitz St Unit 410
- 5251 Galitz St Unit 311
- 5207 Galitz St
- 5037 Fargo Ave
- 7848 Lincoln Ave
- 7748 Lincoln Ave
- 4931 Brummel St
- 4944 Jarvis Ave
- 5505 Oakton St
- 4838 Howard St Unit 301
- 4907 Hull St
- 4906 Hull St
- 4953 Oakton St Unit 510
- 4953 Oakton St Unit P11
- 5304 Howard St
- 5300 Howard St
- 7605 Park Ave
- 7601 Park Ave
- 7609 Park Ave
- 7615 Park Ave
- 7600 Niles Center Rd
- 7616 Niles Center Rd
- 7617 Park Ave
- 7621 Park Ave
- 7620 Niles Center Rd
- 7625 Park Ave
- 7626 Niles Center Rd
- 7600 Park Ave
- 7629 Park Ave
- 7606 Park Ave
- 7632 Niles Center Rd
- 7610 Park Ave
- 7634 Lockwood Ave
- 7601 Niles Center Rd