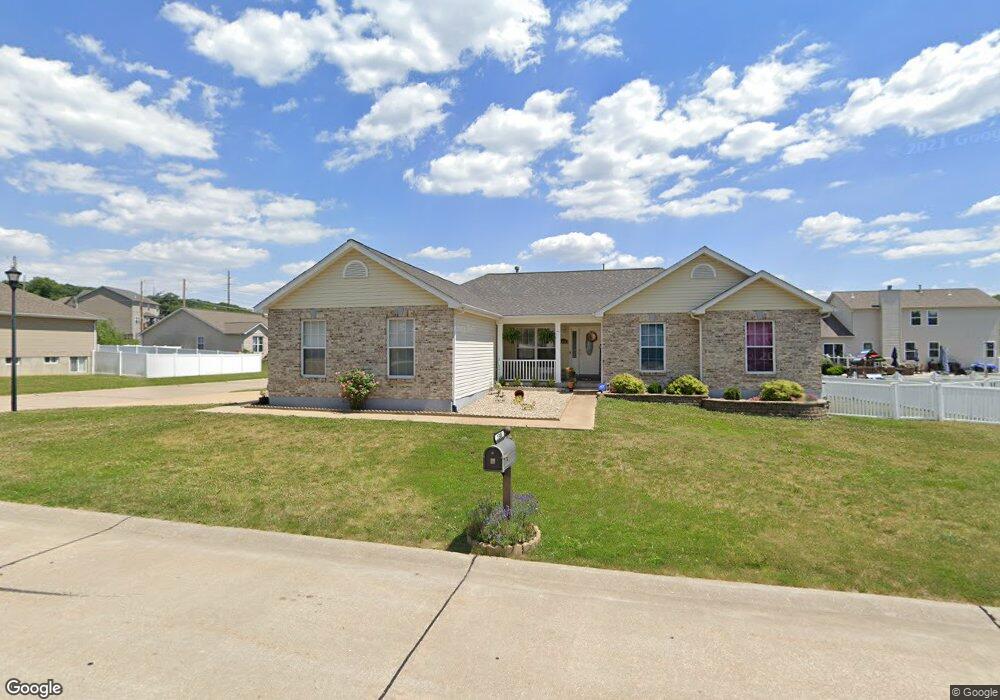
5308 S Bellerieve Ln Imperial, MO 63052
Estimated Value: $365,000 - $412,000
3
Beds
2
Baths
1,808
Sq Ft
$215/Sq Ft
Est. Value
About This Home
This home is located at 5308 S Bellerieve Ln, Imperial, MO 63052 and is currently estimated at $389,261, approximately $215 per square foot. 5308 S Bellerieve Ln is a home located in Jefferson County with nearby schools including Seckman Elementary School, Seckman Middle School, and Seckman Senior High School.
Ownership History
Date
Name
Owned For
Owner Type
Purchase Details
Closed on
Apr 24, 2019
Sold by
Imamovic Elvir
Bought by
Imamovic Elvir and Imamovic Azra
Current Estimated Value
Purchase Details
Closed on
Mar 8, 2012
Sold by
Imamovic Elvir and Imamovic Husein
Bought by
Imamovic Elvir
Home Financials for this Owner
Home Financials are based on the most recent Mortgage that was taken out on this home.
Original Mortgage
$92,200
Outstanding Balance
$63,456
Interest Rate
3.91%
Mortgage Type
New Conventional
Estimated Equity
$325,805
Purchase Details
Closed on
Mar 1, 2006
Sold by
Alpha Omega Construction Inc
Bought by
Imamovic Elvir and Imamovic Husein
Home Financials for this Owner
Home Financials are based on the most recent Mortgage that was taken out on this home.
Original Mortgage
$100,000
Interest Rate
6.05%
Mortgage Type
Fannie Mae Freddie Mac
Purchase Details
Closed on
Aug 5, 2005
Sold by
Chesterfield Valley Development Llc
Bought by
Alpha Omega Construction Inc
Create a Home Valuation Report for This Property
The Home Valuation Report is an in-depth analysis detailing your home's value as well as a comparison with similar homes in the area
Home Values in the Area
Average Home Value in this Area
Purchase History
| Date | Buyer | Sale Price | Title Company |
|---|---|---|---|
| Imamovic Elvir | -- | None Available | |
| Imamovic Elvir | -- | Title Partners Agency Llc | |
| Imamovic Elvir | -- | Htc | |
| Alpha Omega Construction Inc | -- | -- |
Source: Public Records
Mortgage History
| Date | Status | Borrower | Loan Amount |
|---|---|---|---|
| Open | Imamovic Elvir | $92,200 | |
| Closed | Imamovic Elvir | $100,000 |
Source: Public Records
Tax History Compared to Growth
Tax History
| Year | Tax Paid | Tax Assessment Tax Assessment Total Assessment is a certain percentage of the fair market value that is determined by local assessors to be the total taxable value of land and additions on the property. | Land | Improvement |
|---|---|---|---|---|
| 2025 | $3,126 | $51,400 | $7,700 | $43,700 |
| 2024 | $3,126 | $45,900 | $7,700 | $38,200 |
| 2023 | $3,126 | $45,900 | $7,700 | $38,200 |
| 2022 | $3,124 | $45,900 | $7,700 | $38,200 |
| 2021 | $3,125 | $45,900 | $7,700 | $38,200 |
| 2020 | $2,979 | $40,900 | $7,000 | $33,900 |
| 2019 | $2,978 | $40,900 | $7,000 | $33,900 |
| 2018 | $2,951 | $40,900 | $7,000 | $33,900 |
| 2017 | $2,852 | $40,900 | $7,000 | $33,900 |
| 2016 | $2,667 | $38,200 | $7,000 | $31,200 |
| 2015 | $2,661 | $38,200 | $7,000 | $31,200 |
| 2013 | $2,661 | $37,900 | $7,000 | $30,900 |
Source: Public Records
Map
Nearby Homes
- 5144 Copperleaf Dr
- 22 Sun Ridge Estates
- 1045 Remington Dr
- 5160 Cedar Saddle
- 5030 Brook Dr
- 1 Sydney @ Arlington Heights
- 5360 Amber Meadows Dr
- 1020 Timber Creek Ln
- 1 Hartford @ Arlington Heights
- 1051 Timber Creek Ln
- 1 Sienna @ Arlington Heights
- 1 Princeton @ Arlington Heights
- 1 Barkley @ Arlington Heights
- 1 Rockport @ Arlington Heights
- 1 Savoy @ Arlington Heights
- 435 Amber Lake Ct
- 2901 Jack Lynn Dr
- 1 Canterbury @ Arlington Heights
- 1 Rochester @ Arlington Heights
- 1 Westbrook @ Arlington Heights
- 5312 S Bellerieve Ln
- 5368 S Bellerieve Ln
- 5311 S Bellerieve Ln
- 5302 S Bellerieve Ln
- 5364 S Bellerieve Ln
- 5307 S Bellerieve Ln
- 5379 S Bellerieve Ln
- 5316 S Bellerieve Ln
- 5315 S Bellerieve Ln
- 5303 S Bellerieve Ln
- 5360 S Bellerieve Ln
- 5367 S Bellerieve Ln
- 5319 S Bellerieve Ln
- 5375 S Bellerieve Ln
- 5371 S Bellerieve Ln
- 5320 S Bellerieve Ln
- 5363 S Bellerieve Ln
- 5356 S Bellerieve Ln
- 5201 N Bellerieve Ln
- 5205 N Bellerieve Ln