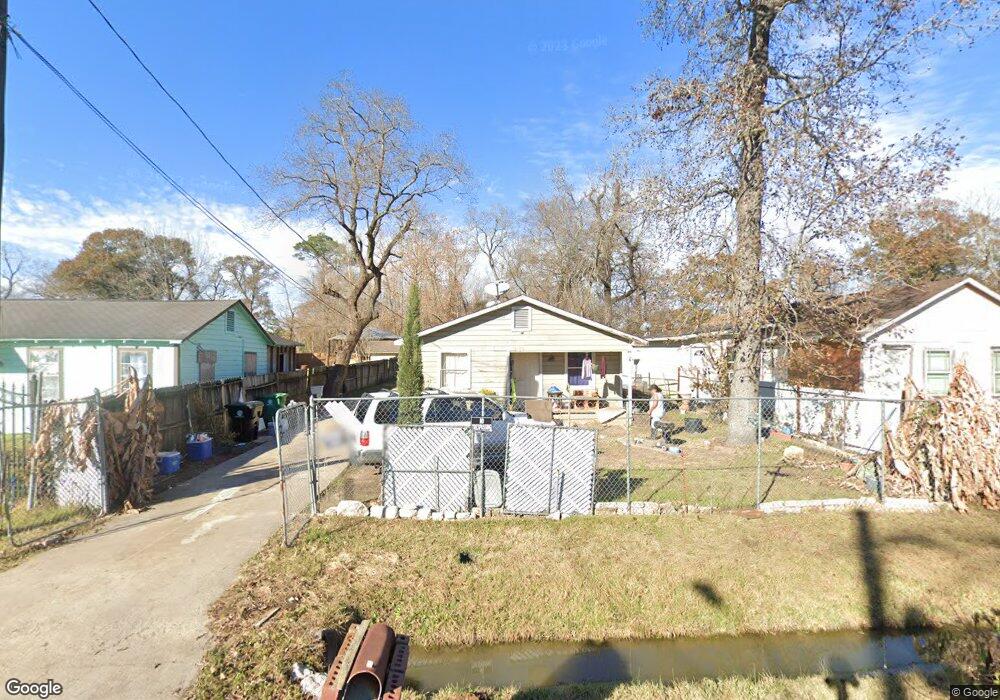
5309 Antha St Houston, TX 77016
East Little York NeighborhoodEstimated Value: $123,000 - $177,000
3
Beds
1
Bath
1,084
Sq Ft
$136/Sq Ft
Est. Value
About This Home
This home is located at 5309 Antha St, Houston, TX 77016 and is currently estimated at $147,448, approximately $136 per square foot. 5309 Antha St is a home located in Harris County with nearby schools including Shadydale Elementary School, Forest Brook Middle, and North Forest High School.
Ownership History
Date
Name
Owned For
Owner Type
Purchase Details
Closed on
Nov 8, 2018
Sold by
Markman Martinez Investments Inc
Bought by
Calderon Armando Mata and Zapata Guadalupe
Current Estimated Value
Home Financials for this Owner
Home Financials are based on the most recent Mortgage that was taken out on this home.
Original Mortgage
$107,000
Interest Rate
3.7%
Mortgage Type
Purchase Money Mortgage
Purchase Details
Closed on
Jul 3, 2018
Sold by
Morin Pedro Herrera and Ortiz Gonzalez Ana Bertha
Bought by
Mbi Mortgage Llc
Purchase Details
Closed on
Nov 16, 2012
Sold by
Mark Martinez Investments
Bought by
Morin Pedro Herrera and Ortiz Gonzalez Bertha
Home Financials for this Owner
Home Financials are based on the most recent Mortgage that was taken out on this home.
Original Mortgage
$71,412
Interest Rate
3.37%
Mortgage Type
New Conventional
Purchase Details
Closed on
Aug 31, 2005
Sold by
Saavedra Julio and Saavedra San Juana
Bought by
Markman Martinez Investments Inc
Create a Home Valuation Report for This Property
The Home Valuation Report is an in-depth analysis detailing your home's value as well as a comparison with similar homes in the area
Home Values in the Area
Average Home Value in this Area
Purchase History
| Date | Buyer | Sale Price | Title Company |
|---|---|---|---|
| Calderon Armando Mata | -- | None Available | |
| Mbi Mortgage Llc | -- | None Available | |
| Morin Pedro Herrera | -- | None Available | |
| Markman Martinez Investments Inc | -- | -- |
Source: Public Records
Mortgage History
| Date | Status | Borrower | Loan Amount |
|---|---|---|---|
| Previous Owner | Calderon Armando Mata | $107,000 | |
| Previous Owner | Morin Pedro Herrera | $71,412 |
Source: Public Records
Tax History Compared to Growth
Tax History
| Year | Tax Paid | Tax Assessment Tax Assessment Total Assessment is a certain percentage of the fair market value that is determined by local assessors to be the total taxable value of land and additions on the property. | Land | Improvement |
|---|---|---|---|---|
| 2025 | $780 | $104,989 | $56,188 | $48,801 |
| 2024 | $780 | $96,844 | $48,938 | $47,906 |
| 2023 | $780 | $80,432 | $30,813 | $49,619 |
| 2022 | $1,172 | $71,422 | $30,813 | $40,609 |
| 2021 | $1,128 | $63,205 | $21,750 | $41,455 |
| 2020 | $1,066 | $44,000 | $21,750 | $22,250 |
| 2019 | $983 | $38,839 | $15,225 | $23,614 |
| 2018 | $919 | $36,302 | $12,688 | $23,614 |
| 2017 | $918 | $36,302 | $12,688 | $23,614 |
| 2016 | $556 | $22,000 | $7,613 | $14,387 |
| 2015 | $566 | $22,000 | $7,613 | $14,387 |
| 2014 | $566 | $22,000 | $7,613 | $14,387 |
Source: Public Records
Map
Nearby Homes
- 4708 Antha St
- 9705 Peachtree St
- 5713 Rietta St
- 5715 Rietta St
- 9421 Sandra St
- 5203 Mayle St
- 5125 Mayle St
- 9325 Grady St
- 9410 Dandy St
- 9711 Bertwood St
- 9603 Bertwood St
- 4606 Tidwell Rd
- 4917 Tronewood St
- 5914 Breland St
- 4924 Tronewood St
- 9118 Sandra St Unit A and B
- 6206 Antha St
- 4915 Fitch St
- 6226 E Tidwell Rd
- 4622 Tidwell Rd
- 5305 Antha St
- 5313 Antha St
- 5301 Antha St
- 5319 Antha St
- 5225 Antha St
- 5221 Antha St
- 5325 Antha St
- 9801 Sandra St
- 5306 Antha St
- 9609 Sandra St
- 9605 Sandra St
- 5228 Antha St
- 5220 Antha St
- 5220 Antha St
- 5220 Antha St Unit B
- 5220 Antha St Unit A
- 5220 Antha St Unit 2
- 5220 Antha St Unit A-B
- 5213 Antha St
- 5703 Antha St