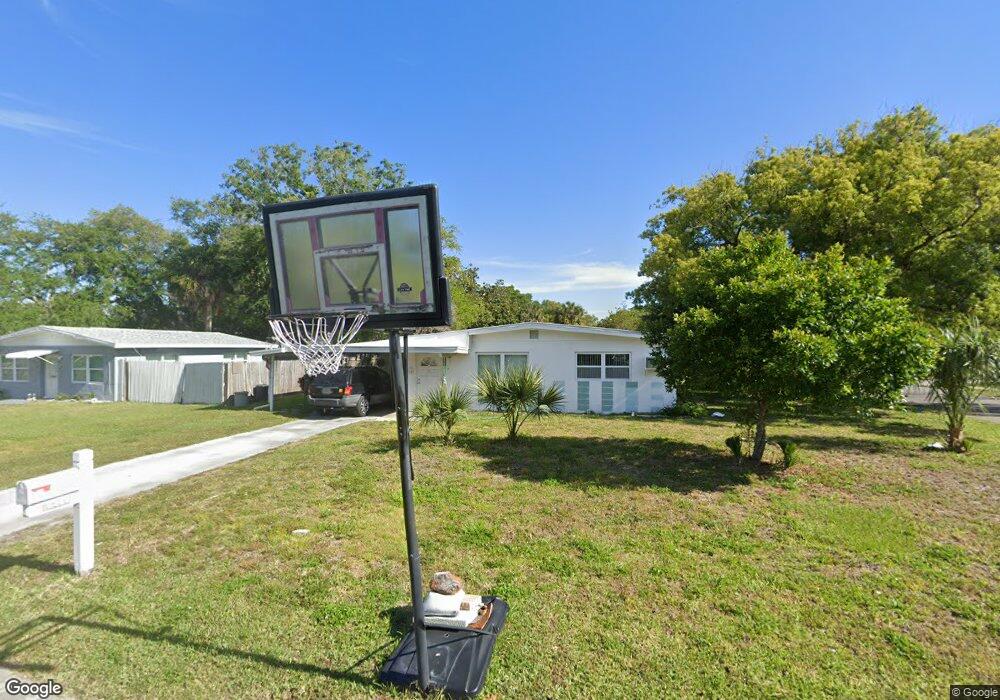
5309 Carlton Rd New Port Richey, FL 34652
Downtown New Port Richey NeighborhoodEstimated Value: $142,515 - $162,000
2
Beds
1
Bath
997
Sq Ft
$153/Sq Ft
Est. Value
About This Home
This home is located at 5309 Carlton Rd, New Port Richey, FL 34652 and is currently estimated at $152,129, approximately $152 per square foot. 5309 Carlton Rd is a home located in Pasco County with nearby schools including Richey Elementary School, Gulf Middle School, and Gulf High School.
Ownership History
Date
Name
Owned For
Owner Type
Purchase Details
Closed on
Aug 14, 2024
Sold by
Wilt Bruce A and Doskoez Richard W
Bought by
Richard W Doskoez & Bruce Wilt Revocable Livi and Doskoez
Current Estimated Value
Purchase Details
Closed on
Jul 27, 2007
Sold by
Johnson Elizabeth
Bought by
Wilt Bruce A and Doskocz Richard W
Purchase Details
Closed on
Oct 30, 2000
Sold by
Klingensmith Sophia T
Bought by
Johnson Elizabeth
Home Financials for this Owner
Home Financials are based on the most recent Mortgage that was taken out on this home.
Original Mortgage
$50,000
Interest Rate
7.91%
Mortgage Type
Purchase Money Mortgage
Purchase Details
Closed on
Nov 14, 1996
Sold by
O'Neill Thomas A and O'Neill Cinda
Bought by
O'Neill Cindi L
Purchase Details
Closed on
Aug 16, 1996
Sold by
Knowles Brenda J
Bought by
Klingensmith Sophia T
Create a Home Valuation Report for This Property
The Home Valuation Report is an in-depth analysis detailing your home's value as well as a comparison with similar homes in the area
Home Values in the Area
Average Home Value in this Area
Purchase History
| Date | Buyer | Sale Price | Title Company |
|---|---|---|---|
| Richard W Doskoez & Bruce Wilt Revocable Livi | $100 | None Listed On Document | |
| Wilt Bruce A | $79,500 | Master Title Service Inc | |
| Johnson Elizabeth | $44,000 | -- | |
| O'Neill Cindi L | $100 | -- | |
| Klingensmith Sophia T | $34,000 | -- |
Source: Public Records
Mortgage History
| Date | Status | Borrower | Loan Amount |
|---|---|---|---|
| Previous Owner | Klingensmith Sophia T | $50,000 |
Source: Public Records
Tax History Compared to Growth
Tax History
| Year | Tax Paid | Tax Assessment Tax Assessment Total Assessment is a certain percentage of the fair market value that is determined by local assessors to be the total taxable value of land and additions on the property. | Land | Improvement |
|---|---|---|---|---|
| 2025 | $2,230 | $108,788 | $33,443 | $75,345 |
| 2024 | $2,230 | $107,764 | $30,443 | $77,321 |
| 2023 | $2,101 | $68,670 | $0 | $0 |
| 2022 | $1,758 | $74,618 | $11,363 | $63,255 |
| 2021 | $1,606 | $62,191 | $11,363 | $50,828 |
| 2020 | $1,475 | $53,356 | $11,363 | $41,993 |
| 2019 | $1,400 | $53,774 | $11,363 | $42,411 |
| 2018 | $1,308 | $50,013 | $11,363 | $38,650 |
| 2017 | $1,200 | $40,723 | $10,283 | $30,440 |
| 2016 | $1,025 | $35,248 | $10,283 | $24,965 |
| 2015 | $1,014 | $34,151 | $10,283 | $23,868 |
| 2014 | $981 | $33,562 | $10,283 | $23,279 |
Source: Public Records
Map
Nearby Homes
- 5323 Carlton Rd
- 5333 Dartmouth Rd
- 5312 Dartmouth Rd
- 5334 Dartmouth Rd
- 5406 Dartmouth Rd
- 5351 Avery Rd
- 5433 Palmetto Rd
- 7137 Wedgewood Dr
- 5436 Palmetto Rd
- 5523 Carlton Rd
- 7369 Royal Palm Dr
- 5113 Avery Rd
- 7139 Pinewood Dr
- 7365 Royal Palm Dr
- 5422 Foley Square
- 7215 Pinewood Dr
- 7124 Jasmin Dr
- 7366 Royal Palm Dr
- 7214 Oakwood Dr
- 7304 Royal Palm Dr
- 5303 Carlton Rd
- 7123 Astor Dr
- 7129 Astor Dr
- 5306 Carlton Rd
- 5326 Carlton Rd
- 5329 Carlton Rd
- 7128 Astor Dr
- 5312 Berkley Rd
- 5306 Berkley Rd
- 7049 Astor Dr
- 5332 Carlton Rd
- 5326 Berkley Rd
- 7118 Us Highway 19
- 7046 Astor Dr
- 5334 Berkley Rd
- 5340 Carlton Rd
- 7121 Green St
- 5313 Dartmouth Rd
- 5307 Dartmouth Rd
- 7038 Us Highway 19