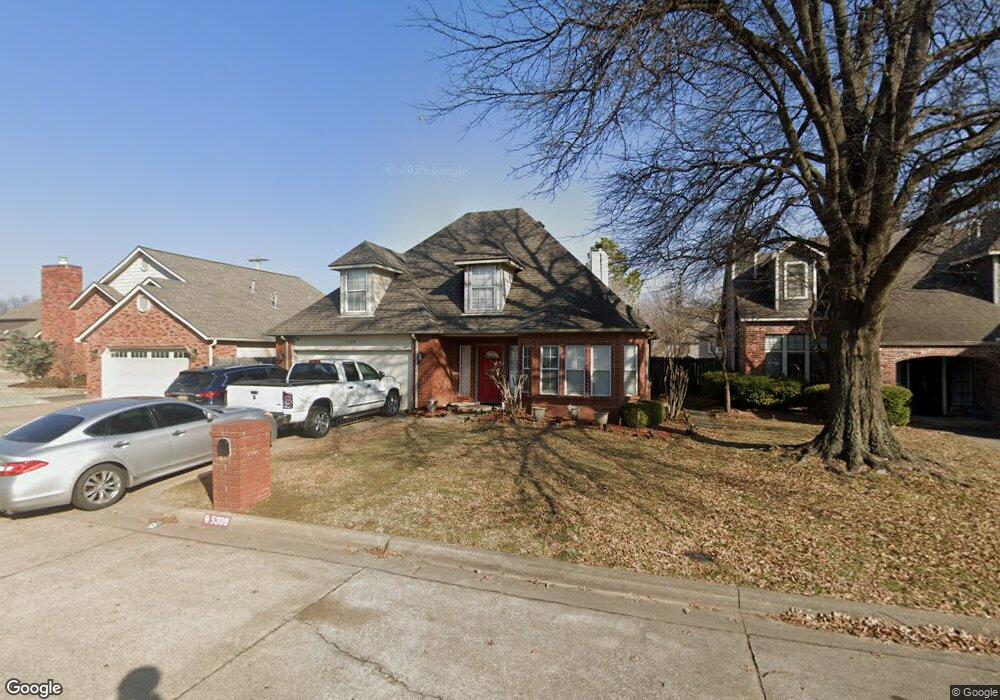
5309 E 93rd St Tulsa, OK 74137
Brookwood NeighborhoodEstimated Value: $287,005 - $358,000
4
Beds
3
Baths
2,533
Sq Ft
$127/Sq Ft
Est. Value
About This Home
This home is located at 5309 E 93rd St, Tulsa, OK 74137 and is currently estimated at $321,751, approximately $127 per square foot. 5309 E 93rd St is a home located in Tulsa County with nearby schools including Jenks East Elementary School, Jenks East Intermediate Elementary School, and Jenks Middle School.
Ownership History
Date
Name
Owned For
Owner Type
Purchase Details
Closed on
May 13, 2014
Sold by
Henderson Latonya Renea
Bought by
Henderson Dwayne Norvell
Current Estimated Value
Purchase Details
Closed on
Jan 9, 2007
Sold by
Goulet Thomas J and Goulet Melissa A
Bought by
Henderson Dwayne and Henderson Latonya R
Home Financials for this Owner
Home Financials are based on the most recent Mortgage that was taken out on this home.
Original Mortgage
$158,746
Outstanding Balance
$93,316
Interest Rate
6.1%
Mortgage Type
FHA
Estimated Equity
$228,435
Purchase Details
Closed on
May 6, 2005
Sold by
Rose R Lynn and Rose Vicki E
Bought by
Goulet Thomas J
Home Financials for this Owner
Home Financials are based on the most recent Mortgage that was taken out on this home.
Original Mortgage
$123,200
Interest Rate
5%
Mortgage Type
Fannie Mae Freddie Mac
Purchase Details
Closed on
Nov 6, 1997
Sold by
Rose R Lynn and Rose Vicki E
Bought by
Rose R Lynn and Rose Vicki E
Purchase Details
Closed on
Feb 1, 1990
Create a Home Valuation Report for This Property
The Home Valuation Report is an in-depth analysis detailing your home's value as well as a comparison with similar homes in the area
Home Values in the Area
Average Home Value in this Area
Purchase History
| Date | Buyer | Sale Price | Title Company |
|---|---|---|---|
| Henderson Dwayne Norvell | -- | None Available | |
| Henderson Dwayne | $213,500 | First Tulsa Title Co | |
| Goulet Thomas J | $154,000 | First American Title & Abstr | |
| Rose R Lynn | -- | Guaranty Abstract Company | |
| -- | $118,000 | -- |
Source: Public Records
Mortgage History
| Date | Status | Borrower | Loan Amount |
|---|---|---|---|
| Open | Henderson Dwayne | $158,746 | |
| Previous Owner | Goulet Thomas J | $123,200 |
Source: Public Records
Tax History
| Year | Tax Paid | Tax Assessment Tax Assessment Total Assessment is a certain percentage of the fair market value that is determined by local assessors to be the total taxable value of land and additions on the property. | Land | Improvement |
|---|---|---|---|---|
| 2025 | $3,103 | $21,951 | $2,661 | $19,290 |
| 2024 | $2,747 | $21,282 | $2,726 | $18,556 |
| 2023 | $2,747 | $21,633 | $2,787 | $18,846 |
| 2022 | $2,746 | $20,003 | $3,751 | $16,252 |
| 2021 | $2,699 | $19,391 | $3,636 | $15,755 |
| 2020 | $2,642 | $19,391 | $3,636 | $15,755 |
| 2019 | $2,732 | $19,391 | $3,636 | $15,755 |
| 2018 | $2,648 | $18,809 | $3,527 | $15,282 |
| 2017 | $2,506 | $19,232 | $3,607 | $15,625 |
| 2016 | $2,439 | $18,672 | $3,626 | $15,046 |
| 2015 | $2,408 | $18,863 | $3,663 | $15,200 |
| 2014 | $2,328 | $17,600 | $3,663 | $13,937 |
Source: Public Records
Map
Nearby Homes
- 9226 S Fulton Ave
- 5127 E 97th Ct
- 4926 E 97th St
- 4616 E 93rd Ct Unit C
- 4608 E 93rd Ct Unit 19
- 9126 S Lakewood Ave
- 4607 E 93rd Ct Unit 18
- 6106 E 93rd St
- 9513 S Lakewood Ave
- 6109 E 91st Place
- 9330 S Oxford Ave
- 6307 E 96th St
- 9021 S Maplewood Ave
- 9752 S Lakewood Ave
- 4418 E 93rd Place S
- 5009 E 86th Place
- 9701 S Richmond Ave
- 6314 E 89th Place Unit 1203
- 6326 E 89th Place Unit 1006
- 5132 E 85th St
- 5315 E 93rd St
- 5303 E 93rd St
- 9213 S Darlington Ave
- 5319 E 93rd St
- 5320 E 92nd St
- 5320 E 92nd St S
- 9209 S Darlington Ave
- 9302 S Darlington Ave
- 9303 S Darlington Ave
- 5324 E 92nd St
- 5323 E 93rd St
- 5316 E 92nd St
- 9306 S Darlington Ave
- 9205 S Darlington Ave
- 9307 S Darlington Ave
- 5325 E 93rd St
- 5243 E 93rd St
- 5328 E 92nd St
- 5324 E 93rd St
- 9310 S Darlington Ave
Your Personal Tour Guide
Ask me questions while you tour the home.