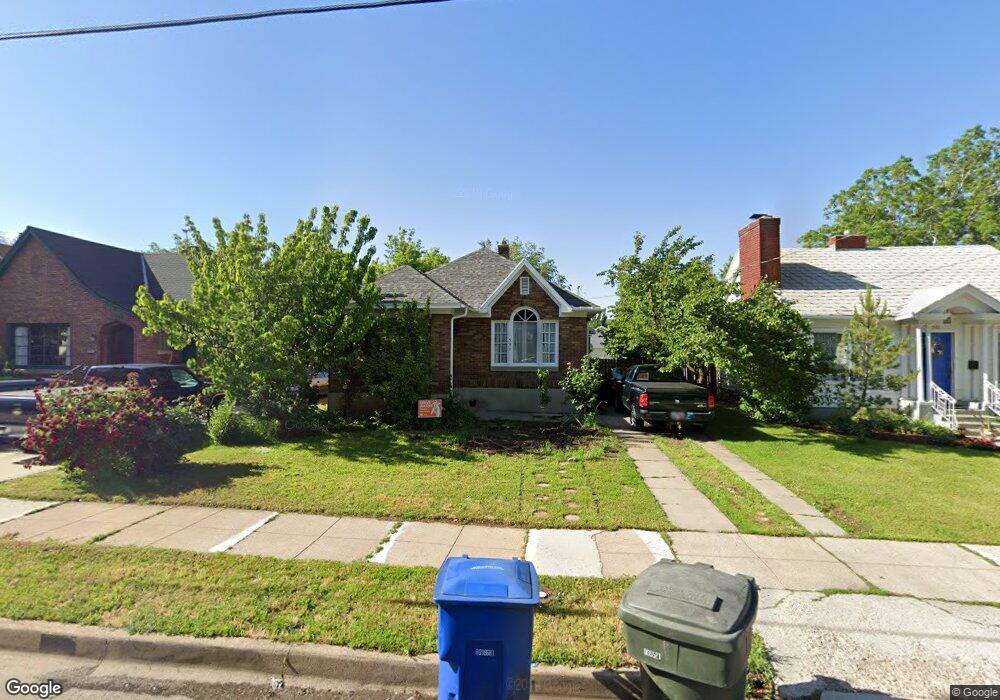
531 13th St Ogden, UT 84404
Canyon Road NeighborhoodEstimated Value: $317,000 - $349,000
3
Beds
2
Baths
1,700
Sq Ft
$196/Sq Ft
Est. Value
About This Home
This home is located at 531 13th St, Ogden, UT 84404 and is currently estimated at $333,382, approximately $196 per square foot. 531 13th St is a home located in Weber County with nearby schools including New Bridge School, Mound Fort Junior High School, and Ben Lomond High School.
Ownership History
Date
Name
Owned For
Owner Type
Purchase Details
Closed on
Nov 11, 2005
Sold by
Cendant Mobility Relocation Co
Bought by
Storrings Kelly
Current Estimated Value
Purchase Details
Closed on
Nov 7, 2005
Sold by
Parchman Gene R
Bought by
Cendant Mobility Relocation Co
Purchase Details
Closed on
Mar 5, 1998
Sold by
Weaver Kenny D
Bought by
Parchman Gene R
Home Financials for this Owner
Home Financials are based on the most recent Mortgage that was taken out on this home.
Original Mortgage
$92,597
Interest Rate
6.99%
Mortgage Type
VA
Purchase Details
Closed on
May 21, 1996
Sold by
Martinez Larry Deon and Page Heidi Ann
Bought by
Weaver Kenny D
Home Financials for this Owner
Home Financials are based on the most recent Mortgage that was taken out on this home.
Original Mortgage
$73,962
Interest Rate
8.07%
Mortgage Type
FHA
Create a Home Valuation Report for This Property
The Home Valuation Report is an in-depth analysis detailing your home's value as well as a comparison with similar homes in the area
Home Values in the Area
Average Home Value in this Area
Purchase History
| Date | Buyer | Sale Price | Title Company |
|---|---|---|---|
| Storrings Kelly | -- | First American Title Ins | |
| Cendant Mobility Relocation Co | -- | First American Title Ins | |
| Parchman Gene R | -- | Mountain View Title | |
| Weaver Kenny D | -- | Mountain View Title |
Source: Public Records
Mortgage History
| Date | Status | Borrower | Loan Amount |
|---|---|---|---|
| Previous Owner | Parchman Gene R | $92,597 | |
| Previous Owner | Weaver Kenny D | $73,962 |
Source: Public Records
Tax History
| Year | Tax Paid | Tax Assessment Tax Assessment Total Assessment is a certain percentage of the fair market value that is determined by local assessors to be the total taxable value of land and additions on the property. | Land | Improvement |
|---|---|---|---|---|
| 2025 | $2,212 | $324,234 | $92,295 | $231,939 |
| 2024 | $2,153 | $170,498 | $50,776 | $119,722 |
| 2023 | $1,905 | $151,801 | $49,551 | $102,250 |
| 2022 | $2,031 | $162,250 | $44,217 | $118,033 |
| 2021 | $1,614 | $214,000 | $40,944 | $173,056 |
| 2020 | $1,412 | $173,000 | $31,723 | $141,277 |
| 2019 | $1,435 | $164,999 | $28,624 | $136,375 |
| 2018 | $1,181 | $135,000 | $28,624 | $106,376 |
| 2017 | $1,059 | $113,000 | $23,547 | $89,453 |
| 2016 | $921 | $53,159 | $13,167 | $39,992 |
| 2015 | $775 | $43,658 | $13,167 | $30,491 |
| 2014 | $757 | $41,867 | $10,517 | $31,350 |
Source: Public Records
Map
Nearby Homes
- 506 14th St
- 443 E 1415 S Unit 118
- 439 E 1415 S Unit 117
- 433 E 1415 S Unit 116
- 486 15th St
- 425 E 1415 S Unit 114
- 1413 S Jefferson Ave
- 1442 S 410 E Unit 134
- 1446 S 410 E Unit 135
- 1424 Jefferson Ave
- 1504 Washington Blvd
- 1529 Jefferson Ave
- 360 13th St
- 344 13th St
- 1107 Jefferson Ave
- 507 Canyon Rd
- 1110 Jefferson Ave
- 425 Canyon Rd
- 284 14th St
- 1324 Liberty Ave
Your Personal Tour Guide
Ask me questions while you tour the home.