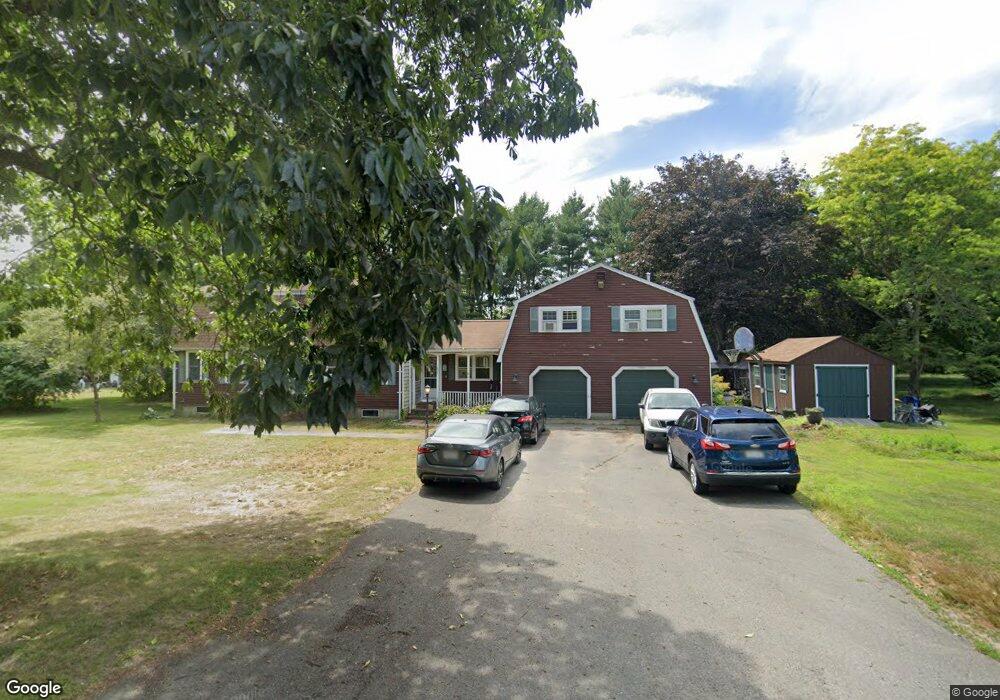
531 Bridge St East Bridgewater, MA 02333
Estimated Value: $724,006 - $849,000
4
Beds
3
Baths
2,470
Sq Ft
$326/Sq Ft
Est. Value
About This Home
This home is located at 531 Bridge St, East Bridgewater, MA 02333 and is currently estimated at $806,002, approximately $326 per square foot. 531 Bridge St is a home located in Plymouth County with nearby schools including Central Elementary School, Gordon W Mitchell Middle School, and East Bridgewater Jr./Sr. High School.
Ownership History
Date
Name
Owned For
Owner Type
Purchase Details
Closed on
May 4, 2005
Sold by
Mcauley Jeanne L
Bought by
Bethune Wesley and Bethune Kerri J
Current Estimated Value
Home Financials for this Owner
Home Financials are based on the most recent Mortgage that was taken out on this home.
Original Mortgage
$403,200
Interest Rate
6.01%
Mortgage Type
Purchase Money Mortgage
Create a Home Valuation Report for This Property
The Home Valuation Report is an in-depth analysis detailing your home's value as well as a comparison with similar homes in the area
Home Values in the Area
Average Home Value in this Area
Purchase History
| Date | Buyer | Sale Price | Title Company |
|---|---|---|---|
| Bethune Wesley | $504,000 | -- |
Source: Public Records
Mortgage History
| Date | Status | Borrower | Loan Amount |
|---|---|---|---|
| Open | Bethune Wesley | $408,000 | |
| Closed | Bethune Wesley | $403,200 | |
| Previous Owner | Bethune Wesley | $85,000 | |
| Previous Owner | Bethune Wesley | $20,000 |
Source: Public Records
Tax History Compared to Growth
Tax History
| Year | Tax Paid | Tax Assessment Tax Assessment Total Assessment is a certain percentage of the fair market value that is determined by local assessors to be the total taxable value of land and additions on the property. | Land | Improvement |
|---|---|---|---|---|
| 2025 | $8,667 | $634,000 | $182,800 | $451,200 |
| 2024 | $8,517 | $615,400 | $175,800 | $439,600 |
| 2023 | $8,271 | $572,400 | $175,800 | $396,600 |
| 2022 | $7,986 | $511,900 | $159,900 | $352,000 |
| 2021 | $4,590 | $459,000 | $153,600 | $305,400 |
| 2020 | $8,275 | $432,500 | $147,700 | $284,800 |
| 2019 | $7,252 | $413,000 | $141,200 | $271,800 |
| 2018 | $4,236 | $395,200 | $141,200 | $254,000 |
| 2017 | $6,892 | $376,600 | $134,600 | $242,000 |
| 2016 | $6,672 | $367,400 | $134,600 | $232,800 |
| 2015 | $6,447 | $363,000 | $133,700 | $229,300 |
| 2014 | $6,319 | $363,800 | $130,900 | $232,900 |
Source: Public Records
Map
Nearby Homes
- 587 Bridge St
- 28 Brookbend Way E
- 26 Meadowbrook Dr
- 182 Crystal Water Dr Unit 182
- 78 Crystal Water Dr
- 217 Crystal Water Dr
- 51 Stonegate Dr
- 455 Plymouth St
- 71 Stonegate Dr
- 121 South St
- 1 Simmons Place
- 1993 Washington St
- 94 Pond St
- 2045 Washington St
- 261 Plymouth St
- 936 Central St
- 71 Church St
- 29 Hayes Rd
- 23 Stone Meadow Dr
- 12 Bridge St
- 545 Bridge St
- 517 Bridge St
- 32 Rolling Hills Dr
- 530 Bridge St
- 30 Rolling Hills Dr
- 34 Rolling Hills Dr
- 559 Bridge St
- 503 Bridge St
- 512 Bridge St
- 28 Rolling Hills Dr
- 573 Bridge St
- 31 Rolling Hills Dr
- 33 Rolling Hills Dr
- 36 Rolling Hills Dr
- 498 Bridge St
- 29 Rolling Hills Dr
- 570 Bridge St
- 552 Bridge St
- 487 Bridge St
- 35 Rolling Hills Dr