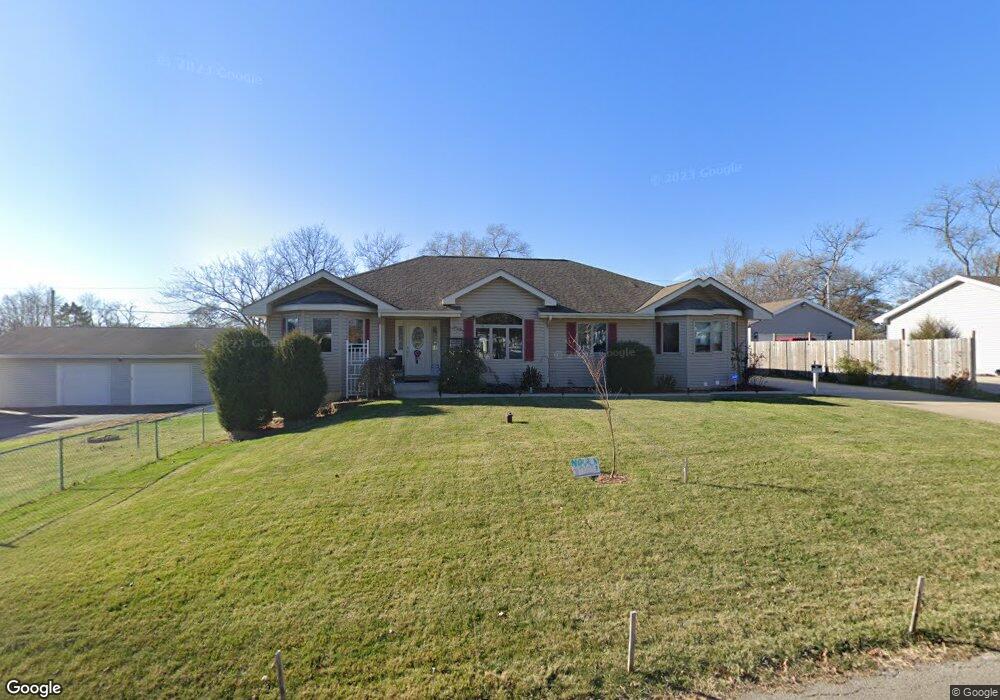
531 Cayuga St Joliet, IL 60432
Belmont NeighborhoodEstimated Value: $231,000 - $273,000
--
Bed
--
Bath
2,112
Sq Ft
$118/Sq Ft
Est. Value
About This Home
This home is located at 531 Cayuga St, Joliet, IL 60432 and is currently estimated at $249,863, approximately $118 per square foot. 531 Cayuga St is a home located in Will County with nearby schools including Isaac Singleton Elementary School, Gompers Junior High School, and Joliet Central High School.
Ownership History
Date
Name
Owned For
Owner Type
Purchase Details
Closed on
Apr 10, 2006
Sold by
Choat Joseph S
Bought by
First Midwest Bank and Trust #8255
Current Estimated Value
Purchase Details
Closed on
Jan 31, 2006
Sold by
Brooks Anna L
Bought by
Choat Joseph S
Purchase Details
Closed on
Apr 25, 2003
Sold by
Palacios Ildefonso C and Palacios Laura L
Bought by
Choat Joseph S and Brooks Anna L
Home Financials for this Owner
Home Financials are based on the most recent Mortgage that was taken out on this home.
Original Mortgage
$177,493
Interest Rate
5.86%
Mortgage Type
FHA
Purchase Details
Closed on
Oct 6, 2000
Sold by
Cherry Glenn L and Cherry Pamela A
Bought by
Palacios Ildefonso C and Palacios Laurie L
Create a Home Valuation Report for This Property
The Home Valuation Report is an in-depth analysis detailing your home's value as well as a comparison with similar homes in the area
Home Values in the Area
Average Home Value in this Area
Purchase History
| Date | Buyer | Sale Price | Title Company |
|---|---|---|---|
| First Midwest Bank | -- | None Available | |
| Choat Joseph S | $35,000 | None Available | |
| Choat Joseph S | $180,000 | Ticor Title | |
| Palacios Ildefonso C | $12,500 | First American Title |
Source: Public Records
Mortgage History
| Date | Status | Borrower | Loan Amount |
|---|---|---|---|
| Previous Owner | Choat Joseph S | $177,493 |
Source: Public Records
Tax History Compared to Growth
Tax History
| Year | Tax Paid | Tax Assessment Tax Assessment Total Assessment is a certain percentage of the fair market value that is determined by local assessors to be the total taxable value of land and additions on the property. | Land | Improvement |
|---|---|---|---|---|
| 2024 | $5,843 | $78,735 | $6,207 | $72,528 |
| 2023 | $5,843 | $69,956 | $5,515 | $64,441 |
| 2022 | $5,277 | $63,280 | $4,989 | $58,291 |
| 2021 | $4,983 | $59,102 | $4,660 | $54,442 |
| 2020 | $4,732 | $56,127 | $4,425 | $51,702 |
| 2019 | $4,978 | $52,162 | $4,112 | $48,050 |
| 2018 | $4,641 | $46,769 | $3,666 | $43,103 |
| 2017 | $4,448 | $42,521 | $3,333 | $39,188 |
| 2016 | $4,360 | $39,994 | $3,040 | $36,954 |
| 2015 | $4,152 | $37,500 | $2,850 | $34,650 |
| 2014 | $4,152 | $37,350 | $2,850 | $34,500 |
| 2013 | $4,152 | $40,282 | $3,193 | $37,089 |
Source: Public Records
Map
Nearby Homes
- 607 Cayuga St
- 1607 Maple Rd
- 426 N Hebbard St
- 1602 E Cass St
- 2208 Fiesta Dr
- 411 Leach Ave
- 2103 Maple Rd
- 2216 Beechwood Rd
- 1205 Gage Ct
- 1208 Hague St
- 1215 Clark St
- 1215 Ada St
- 2406 Brush Hill Cir
- 1324 Demmond St
- 24 NE Circle Dr
- 2417 Fleetwood Dr
- 2116 Hanover St
- 120 Anderson Ave
- 1111 Colonial Dr Unit 1
- 1019 Magnolia Ave