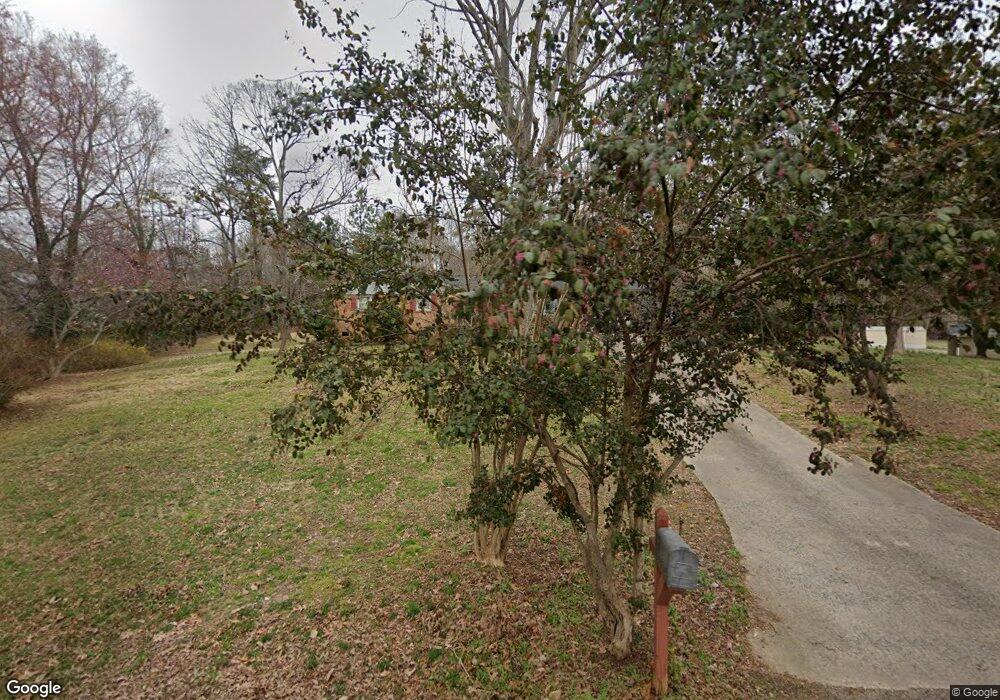
531 Clyde Wallace Rd Shelby, NC 28152
Estimated Value: $195,000 - $222,000
--
Bed
--
Bath
1,468
Sq Ft
$146/Sq Ft
Est. Value
About This Home
This home is located at 531 Clyde Wallace Rd, Shelby, NC 28152 and is currently estimated at $214,062, approximately $145 per square foot. 531 Clyde Wallace Rd is a home located in Cleveland County with nearby schools including Boiling Springs Elementary School, Crest Middle School, and Crest High School.
Ownership History
Date
Name
Owned For
Owner Type
Purchase Details
Closed on
Jan 3, 2020
Sold by
Morgan Mark A and Morgan Connie J
Bought by
Lund Beth and Morgan Mark A
Current Estimated Value
Purchase Details
Closed on
Jan 22, 2016
Sold by
Hicks Sharon W and Hicks Billy Ray
Bought by
Morgan Mark A and Morgan Connie J
Home Financials for this Owner
Home Financials are based on the most recent Mortgage that was taken out on this home.
Original Mortgage
$76,000
Outstanding Balance
$60,484
Interest Rate
3.98%
Mortgage Type
New Conventional
Estimated Equity
$153,578
Purchase Details
Closed on
Sep 4, 2015
Sold by
Baldwin Virginia R and Baldwin Ernest S
Bought by
Rogers Jason and Crimmins Craig
Purchase Details
Closed on
Jan 25, 2008
Sold by
Webb Sue M
Bought by
Webb Curtis and Hicks Sharon W
Create a Home Valuation Report for This Property
The Home Valuation Report is an in-depth analysis detailing your home's value as well as a comparison with similar homes in the area
Home Values in the Area
Average Home Value in this Area
Purchase History
| Date | Buyer | Sale Price | Title Company |
|---|---|---|---|
| Lund Beth | -- | None Available | |
| Morgan Mark A | $95,000 | None Available | |
| Rogers Jason | -- | None Available | |
| Webb Curtis | -- | None Available |
Source: Public Records
Mortgage History
| Date | Status | Borrower | Loan Amount |
|---|---|---|---|
| Open | Morgan Mark A | $76,000 |
Source: Public Records
Tax History Compared to Growth
Tax History
| Year | Tax Paid | Tax Assessment Tax Assessment Total Assessment is a certain percentage of the fair market value that is determined by local assessors to be the total taxable value of land and additions on the property. | Land | Improvement |
|---|---|---|---|---|
| 2025 | $882 | $138,862 | $25,000 | $113,862 |
| 2024 | $946 | $108,878 | $25,000 | $83,878 |
| 2023 | $938 | $108,509 | $25,000 | $83,509 |
| 2022 | $938 | $108,509 | $25,000 | $83,509 |
| 2021 | $941 | $108,509 | $25,000 | $83,509 |
| 2020 | $827 | $91,098 | $21,000 | $70,098 |
| 2019 | $827 | $91,098 | $21,000 | $70,098 |
| 2018 | $823 | $91,098 | $21,000 | $70,098 |
| 2017 | $819 | $91,098 | $21,000 | $70,098 |
| 2016 | $782 | $91,098 | $21,000 | $70,098 |
| 2015 | $796 | $92,966 | $21,000 | $71,966 |
| 2014 | $796 | $92,966 | $21,000 | $71,966 |
Source: Public Records
Map
Nearby Homes
- 231 Pineland Ave Unit 1
- 1815 Gaffney Rd
- 1622 Patrick Ave
- 322 S Main St
- 125 Flint Hill Church Rd
- 107 Southern Pines Dr
- 118 Southern Pine Dr
- TBD Patrick Ave
- 129 Creekside Dr
- 301 Oak Ave
- 133 Brookview Dr
- 109 Landon Ct
- 300 Hidden Creek Dr
- 0 W College Ave
- 245 E College Ave
- 116 Fairview St
- 339 W College Ave
- 0 Patrick Ave Unit LotWP001
- 230 Poston Cir
- 00 Rockford Rd
- 1936 Holly Hill Rd
- 523 Clyde Wallace R Rd
- 530 Clyde Wallace Rd
- 2002 Holly Hill Rd
- 522 Clyde Wallace Rd
- 2001 Holly Hill Rd
- 1935 Holly Hill Rd
- 2005 Holly Hill Rd
- 2012 Holly Hill Rd
- 521 Clyde Wallace Rd
- 507 Clyde Wallace Rd
- 2014 Holly Hill Rd
- 235 Pineland Ave
- 501 Clyde Wallace Rd
- 221 Pineland Ave
- 225 Pineland Ave
- 1820 Gaffney Rd
- 500 Clyde Wallace Rd
- 114 Barth Cir
- 217 Pineland Ave