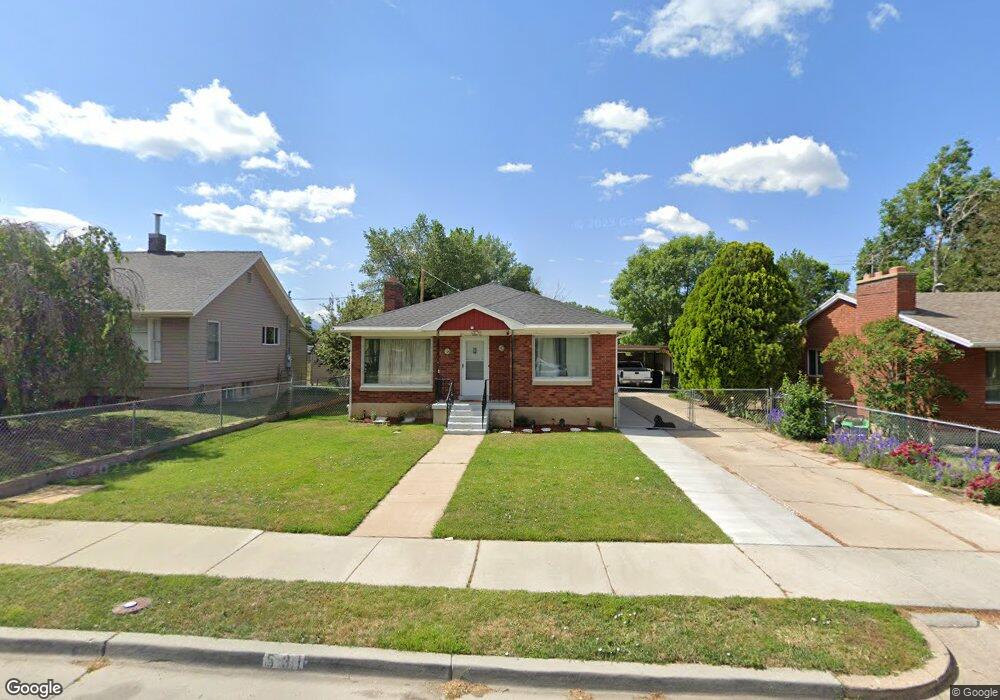
531 Cross St Ogden, UT 84404
Hillcrest-Bonneville NeighborhoodEstimated Value: $355,000 - $402,026
4
Beds
2
Baths
2,154
Sq Ft
$177/Sq Ft
Est. Value
About This Home
This home is located at 531 Cross St, Ogden, UT 84404 and is currently estimated at $382,257, approximately $177 per square foot. 531 Cross St is a home located in Weber County with nearby schools including Bonneville School, Highland Junior High School, and Ben Lomond High School.
Ownership History
Date
Name
Owned For
Owner Type
Purchase Details
Closed on
Oct 15, 2019
Sold by
Bravo Rafael Menchaca
Bought by
Calderon Manuel Castaneda
Current Estimated Value
Home Financials for this Owner
Home Financials are based on the most recent Mortgage that was taken out on this home.
Original Mortgage
$159,120
Outstanding Balance
$139,397
Interest Rate
3.5%
Mortgage Type
New Conventional
Estimated Equity
$242,860
Purchase Details
Closed on
Nov 13, 2014
Sold by
Brown Lois Jeanne
Bought by
Bravo Rafael Menchaca
Home Financials for this Owner
Home Financials are based on the most recent Mortgage that was taken out on this home.
Original Mortgage
$117,826
Interest Rate
3.62%
Mortgage Type
FHA
Purchase Details
Closed on
Oct 5, 2005
Sold by
Brown Lois L and Brown Lois Jeanne
Bought by
Brown Lois Jeanne
Purchase Details
Closed on
Sep 19, 2005
Sold by
Brown Lois L and Brown Lois Jeanne
Bought by
Brown Lois Jeanne
Create a Home Valuation Report for This Property
The Home Valuation Report is an in-depth analysis detailing your home's value as well as a comparison with similar homes in the area
Home Values in the Area
Average Home Value in this Area
Purchase History
| Date | Buyer | Sale Price | Title Company |
|---|---|---|---|
| Calderon Manuel Castaneda | -- | Vanguard Title Ins Agcy | |
| Bravo Rafael Menchaca | -- | Mountain View Title | |
| Brown Lois Jeanne | -- | -- | |
| Brown Lois Jeanne | -- | -- |
Source: Public Records
Mortgage History
| Date | Status | Borrower | Loan Amount |
|---|---|---|---|
| Open | Calderon Manuel Castaneda | $159,120 | |
| Previous Owner | Bravo Rafael Menchaca | $117,826 |
Source: Public Records
Tax History Compared to Growth
Tax History
| Year | Tax Paid | Tax Assessment Tax Assessment Total Assessment is a certain percentage of the fair market value that is determined by local assessors to be the total taxable value of land and additions on the property. | Land | Improvement |
|---|---|---|---|---|
| 2025 | $2,696 | $395,174 | $122,726 | $272,448 |
| 2024 | $2,549 | $201,849 | $67,499 | $134,350 |
| 2023 | $2,402 | $191,400 | $57,938 | $133,462 |
| 2022 | $2,712 | $216,700 | $49,561 | $167,139 |
| 2021 | $1,999 | $265,000 | $59,632 | $205,368 |
| 2020 | $1,829 | $224,000 | $48,200 | $175,800 |
| 2019 | $1,765 | $203,000 | $37,979 | $165,021 |
| 2018 | $1,531 | $175,000 | $33,607 | $141,393 |
| 2017 | $1,312 | $140,000 | $33,607 | $106,393 |
| 2016 | $1,338 | $77,207 | $14,467 | $62,740 |
| 2015 | $1,016 | $57,190 | $14,467 | $42,723 |
| 2014 | $997 | $55,108 | $12,583 | $42,525 |
Source: Public Records
Map
Nearby Homes