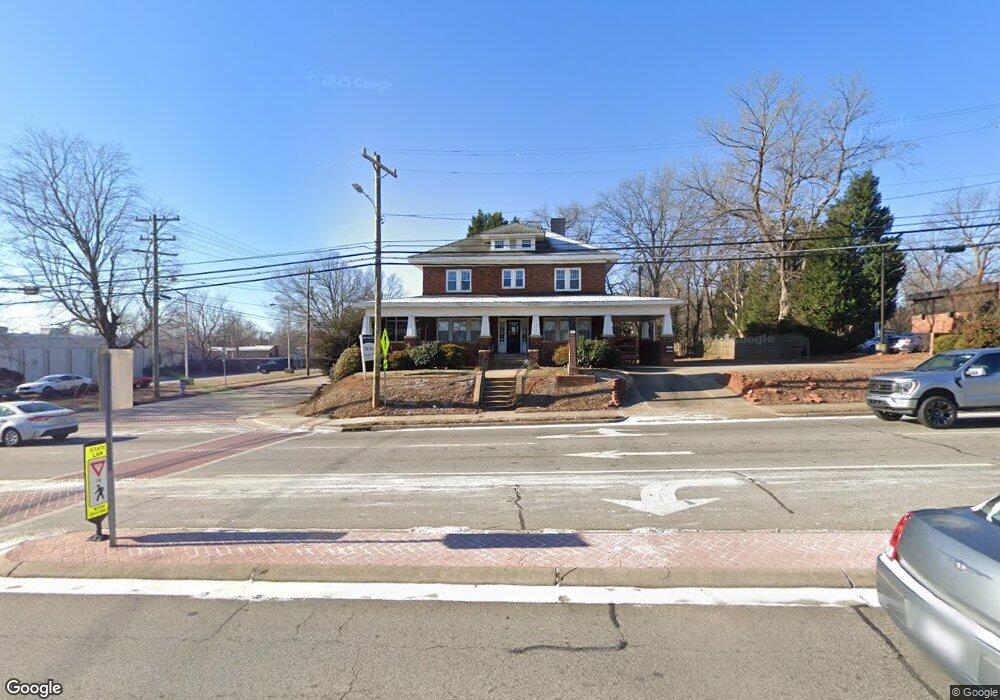
531 E Innes St Unit NULL Salisbury, NC 28144
Estimated Value: $302,000 - $480,000
Studio
--
Bath
3,560
Sq Ft
$105/Sq Ft
Est. Value
About This Home
This home is located at 531 E Innes St Unit NULL, Salisbury, NC 28144 and is currently estimated at $372,427, approximately $104 per square foot. 531 E Innes St Unit NULL is a home located in Rowan County with nearby schools including Elizabeth Duncan Koontz Elementary School, North Rowan Middle School, and Salisbury High School.
Ownership History
Date
Name
Owned For
Owner Type
Purchase Details
Closed on
Jan 7, 2025
Sold by
Mallard Point Investments Llc and Mallard Holdings Llc
Bought by
Thorinson V Llc
Current Estimated Value
Purchase Details
Closed on
Feb 27, 2023
Sold by
Haigh Investments Llc
Bought by
Mallard Point Investments Llc
Purchase Details
Closed on
Oct 24, 2013
Sold by
Parks Property Management Llc
Bought by
Haigh Investments Llc
Home Financials for this Owner
Home Financials are based on the most recent Mortgage that was taken out on this home.
Original Mortgage
$187,000
Interest Rate
4.57%
Mortgage Type
Unknown
Purchase Details
Closed on
Jul 14, 2004
Sold by
Parks Charles F and Parks Lynne D
Bought by
Parks Property Management Llc
Create a Home Valuation Report for This Property
The Home Valuation Report is an in-depth analysis detailing your home's value as well as a comparison with similar homes in the area
Home Values in the Area
Average Home Value in this Area
Purchase History
We collect this data history from publicly available records. To have your information removed, we recommend requesting removal directly through your county’s website.
| Date | Buyer | Sale Price | Title Company |
|---|---|---|---|
| Thorinson V Llc | $275,000 | None Listed On Document | |
| Thorinson V Llc | $275,000 | None Listed On Document | |
| Mallard Point Investments Llc | -- | -- | |
| Mallard Point Investments Llc | -- | None Listed On Document | |
| Haigh Investments Llc | $220,000 | None Available | |
| Parks Property Management Llc | -- | -- |
Source: Public Records
Mortgage History
We collect this data history from publicly available records. To have your information removed, we recommend requesting removal directly through your county’s website.
| Date | Status | Borrower | Loan Amount |
|---|---|---|---|
| Previous Owner | Haigh Investments Llc | $187,000 |
Source: Public Records
Tax History
| Year | Tax Paid | Tax Assessment Tax Assessment Total Assessment is a certain percentage of the fair market value that is determined by local assessors to be the total taxable value of land and additions on the property. | Land | Improvement |
|---|---|---|---|---|
| 2025 | $3,748 | $313,417 | $211,019 | $102,398 |
| 2024 | $3,748 | $313,417 | $211,019 | $102,398 |
| 2023 | $3,748 | $313,417 | $211,019 | $102,398 |
| 2022 | $4,394 | $319,104 | $211,019 | $108,085 |
| 2021 | $4,394 | $319,104 | $211,019 | $108,085 |
| 2020 | $4,394 | $319,104 | $211,019 | $108,085 |
| 2019 | $4,394 | $319,104 | $211,019 | $108,085 |
| 2018 | $4,083 | $300,497 | $211,018 | $89,479 |
| 2017 | $4,061 | $300,497 | $211,018 | $89,479 |
| 2016 | $3,950 | $300,497 | $211,018 | $89,479 |
| 2015 | $3,974 | $300,497 | $211,018 | $89,479 |
| 2014 | $3,994 | $305,574 | $211,018 | $94,556 |
Source: Public Records
Map
Nearby Homes
- 531 E Fisher St
- 204 S Shaver St
- 409 E Fisher St
- 420 E Bank St
- 205 N Martin Luther King jr Ave
- 321 S Shaver St
- 0 N Green St Unit 13
- 322 E Council St
- 303 E Fisher St
- 507 Park Ave
- 403 S Long St
- 139 S Lee St Unit 14
- 122 E Innes St
- 0 Brown St
- 828 Park Ave
- 123 N Main St
- 328 Old Concord Rd
- 59 Cedar St
- 501 S Main St
- 501 E Lafayette St
- 531 E Innes St
- 114 S Clay St
- 3 N Clay St
- 116 S Clay St
- 120 S Clay St
- 518 E Fisher St
- 501 E Innes St Unit NULL
- 530 E Fisher St
- 526 E Fisher St
- 514 E Fisher St
- 524 E Fisher St
- 512 E Fisher St
- 512 E Fisher St Unit NULL
- 117 S Shaver St
- 109 S Shaver St
- 618 E Innes St
- 508 E Fisher St
- 121 S Shaver St
- 121 S Shaver St Unit NULL
- 121 1 S Shaver St
Your Personal Tour Guide
Ask me questions while you tour the home.