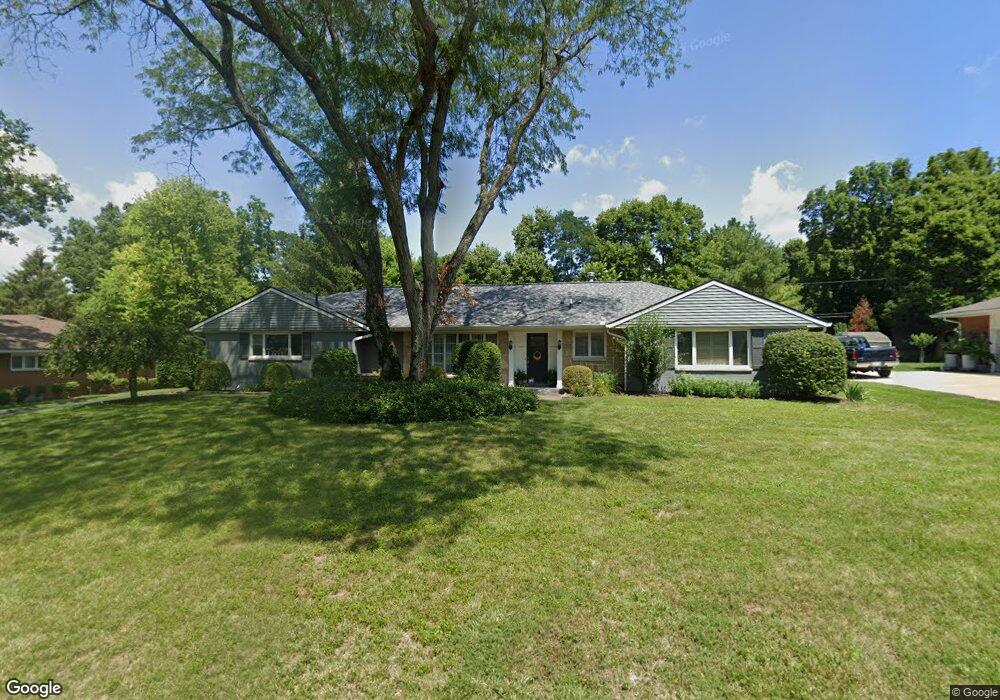
531 Elderwood Rd Dayton, OH 45429
Estimated Value: $369,191 - $488,000
3
Beds
3
Baths
2,379
Sq Ft
$176/Sq Ft
Est. Value
About This Home
This home is located at 531 Elderwood Rd, Dayton, OH 45429 and is currently estimated at $419,048, approximately $176 per square foot. 531 Elderwood Rd is a home located in Montgomery County with nearby schools including Southdale Elementary School, Van Buren Middle School, and Kettering Fairmont High School.
Ownership History
Date
Name
Owned For
Owner Type
Purchase Details
Closed on
Jun 28, 2012
Sold by
Denison Ann Wiley
Bought by
Thompson Eric L and Thompson Sara E
Current Estimated Value
Home Financials for this Owner
Home Financials are based on the most recent Mortgage that was taken out on this home.
Original Mortgage
$199,500
Outstanding Balance
$138,362
Interest Rate
3.77%
Mortgage Type
FHA
Estimated Equity
$280,686
Purchase Details
Closed on
Jun 17, 2010
Sold by
Denison Ann W and Denison Donald Burton
Bought by
Denison Ann Wiley
Purchase Details
Closed on
Aug 31, 2004
Sold by
Nellis Hildegarde B and Nellis James K
Bought by
Denison Ann W
Home Financials for this Owner
Home Financials are based on the most recent Mortgage that was taken out on this home.
Original Mortgage
$125,000
Interest Rate
6.08%
Mortgage Type
Fannie Mae Freddie Mac
Purchase Details
Closed on
Mar 17, 1998
Sold by
Zelik Daniel B and Zelik Lori L
Bought by
Klenke Joseph L and Klenke Lori A
Home Financials for this Owner
Home Financials are based on the most recent Mortgage that was taken out on this home.
Original Mortgage
$142,000
Interest Rate
7.15%
Create a Home Valuation Report for This Property
The Home Valuation Report is an in-depth analysis detailing your home's value as well as a comparison with similar homes in the area
Home Values in the Area
Average Home Value in this Area
Purchase History
| Date | Buyer | Sale Price | Title Company |
|---|---|---|---|
| Thompson Eric L | $215,000 | Fidelity Lawyers Title Agenc | |
| Denison Ann Wiley | -- | Attorney | |
| Denison Ann W | $250,000 | None Available | |
| Klenke Joseph L | $177,500 | -- | |
| Klenke Joseph L | $177,500 | -- |
Source: Public Records
Mortgage History
| Date | Status | Borrower | Loan Amount |
|---|---|---|---|
| Open | Thompson Eric L | $199,500 | |
| Previous Owner | Denison Ann W | $125,000 | |
| Previous Owner | Klenke Joseph L | $142,000 |
Source: Public Records
Tax History Compared to Growth
Tax History
| Year | Tax Paid | Tax Assessment Tax Assessment Total Assessment is a certain percentage of the fair market value that is determined by local assessors to be the total taxable value of land and additions on the property. | Land | Improvement |
|---|---|---|---|---|
| 2024 | $6,262 | $101,160 | $22,060 | $79,100 |
| 2023 | $6,262 | $101,160 | $22,060 | $79,100 |
| 2022 | $5,967 | $76,230 | $16,590 | $59,640 |
| 2021 | $5,518 | $76,230 | $16,590 | $59,640 |
| 2020 | $5,534 | $76,230 | $16,590 | $59,640 |
| 2019 | $5,249 | $63,920 | $16,590 | $47,330 |
| 2018 | $5,277 | $63,920 | $16,590 | $47,330 |
| 2017 | $4,860 | $63,920 | $16,590 | $47,330 |
| 2016 | $5,138 | $63,520 | $16,590 | $46,930 |
| 2015 | $4,908 | $63,520 | $16,590 | $46,930 |
| 2014 | $4,908 | $63,520 | $16,590 | $46,930 |
| 2012 | -- | $57,830 | $16,250 | $41,580 |
Source: Public Records
Map
Nearby Homes
- 516 Pauley Woods Cir
- 4241 Schrubb Dr
- 298 Marchester Dr
- 3993 Applewood Ln
- 4400 Royal Ridge Way
- 4951 Walnut Walk
- 209 Westhaven Dr
- 5095 Wheaton St
- 5303 Split Rail
- 309 Henrich Dr
- 5290 Wheaton St
- 3325 Ridgeway Rd
- 215 Colonial Ln
- 115 N Bromfield Rd
- 4824 Far Hills Ave
- 4808 Judith Dr
- 4816 Judith Dr
- 4259 Maxlin Rd
- 3720 Ridgeleigh Rd Unit D
- 5048 Oak Manor Ct
- 523 Elderwood Rd
- 539 Elderwood Rd
- 4363 Trails End Dr
- 538 Elderwood Rd
- 547 Elderwood Rd
- 515 Elderwood Rd
- 540 Elderwood Rd
- 524 Elderwood Rd
- 548 Elderwood Rd
- 516 Elderwood Rd
- 555 Elderwood Rd
- 507 Elderwood Rd
- 4350 Trails End Dr
- 4321 Overland Trail
- 556 Elderwood Rd
- 4345 Trails End Dr
- 4458 Blairgowrie Cir
- 508 Elderwood Rd
- 4457 Blairgowrie Cir
- 563 Elderwood Rd