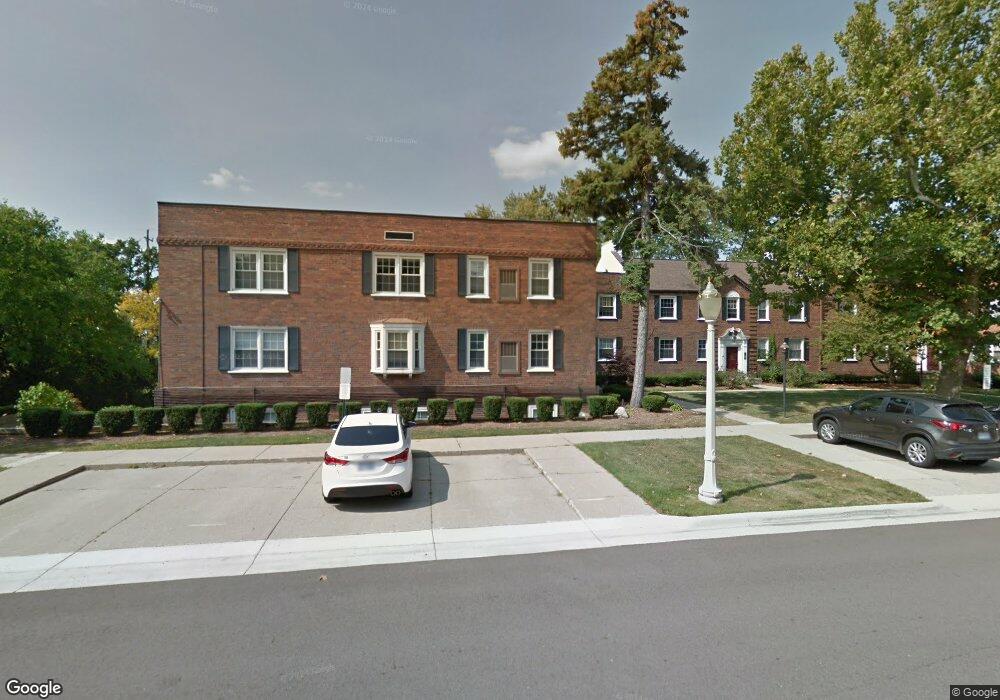
531 Glenmoor Rd Unit 3C East Lansing, MI 48823
Estimated Value: $124,000 - $145,000
1
Bed
1
Bath
618
Sq Ft
$214/Sq Ft
Est. Value
About This Home
This home is located at 531 Glenmoor Rd Unit 3C, East Lansing, MI 48823 and is currently estimated at $132,540, approximately $214 per square foot. 531 Glenmoor Rd Unit 3C is a home located in Ingham County with nearby schools including Glencairn School, MacDonald Middle School, and East Lansing High School.
Ownership History
Date
Name
Owned For
Owner Type
Purchase Details
Closed on
Mar 14, 2008
Sold by
Stanton Debra J and Villarreal Debra J
Bought by
Stanton Steven E and Stanton Debra J V
Current Estimated Value
Purchase Details
Closed on
Jul 1, 1994
Purchase Details
Closed on
Jan 1, 1992
Purchase Details
Closed on
Dec 1, 1987
Create a Home Valuation Report for This Property
The Home Valuation Report is an in-depth analysis detailing your home's value as well as a comparison with similar homes in the area
Home Values in the Area
Average Home Value in this Area
Purchase History
| Date | Buyer | Sale Price | Title Company |
|---|---|---|---|
| Stanton Steven E | -- | None Available | |
| -- | $39,500 | -- | |
| -- | $39,400 | -- | |
| -- | $36,000 | -- |
Source: Public Records
Tax History Compared to Growth
Tax History
| Year | Tax Paid | Tax Assessment Tax Assessment Total Assessment is a certain percentage of the fair market value that is determined by local assessors to be the total taxable value of land and additions on the property. | Land | Improvement |
|---|---|---|---|---|
| 2025 | $2,304 | $44,000 | $0 | $44,000 |
| 2024 | $2,162 | $42,500 | $0 | $42,500 |
| 2023 | $2,162 | $43,100 | $0 | $43,100 |
| 2022 | $2,068 | $38,700 | $0 | $38,700 |
| 2021 | $2,025 | $35,000 | $0 | $35,000 |
| 2020 | $2,002 | $29,600 | $0 | $29,600 |
| 2019 | $1,931 | $30,100 | $0 | $30,100 |
| 2018 | $2,055 | $30,100 | $0 | $30,100 |
| 2017 | $1,982 | $29,800 | $0 | $29,800 |
| 2016 | -- | $29,300 | $0 | $29,300 |
| 2015 | -- | $27,200 | $0 | $0 |
| 2014 | -- | $27,000 | $0 | $0 |
Source: Public Records
Map
Nearby Homes
- 615 Glenmoor Rd Unit 2A
- 728 Audubon Rd
- 350 Kensington Rd
- 1017 Coolidge Rd
- 1207 Chartwell Carriage Way S
- 1048 Shelter Ln
- 992 Touraine Ave
- 119 Kensington Rd
- 805 Southlawn Ave
- 1283 Chartwell Carriage Way N
- 922 Michigan Ave
- 620 Ardson Rd
- 2635 Lasalle Blvd
- 2609 E Saginaw St
- 1409 Weatherhill Ct Unit 9
- 1043 Kimberly Dr Unit 11
- 601 N Francis Ave
- 953 Rosewood Ave
- 417 N Francis Ave
- 620 N Foster Ave
- 531 Glenmoor Rd Unit 2A
- 531 Glenmoor Rd Unit 3D
- 531 Glenmoor Rd Unit 1C
- 531 Glenmoor Rd Unit 2D
- 531 Glenmoor Rd Unit 2B
- 531 Glenmoor Rd Unit 1A
- 531 Glenmoor Rd Unit 1B
- 531 Glenmoor Rd
- 535 Glenmoor Rd Unit 3A
- 535 Glenmoor Rd Unit 2A
- 535 Glenmoor Rd Unit 2B
- 535 Glenmoor Rd Unit 3B
- 535 Glenmoor Rd Unit 2a
- 535 Glenmoor Rd
- 539 E Glenmoor 2c
- 539 Glenmoor Rd
- 539 Glenmoor Rd Unit 3a
- 539 Glenmoor Rd Unit C2
- 539 Glenmoor Rd Unit D
- 539 Glenmoor Rd