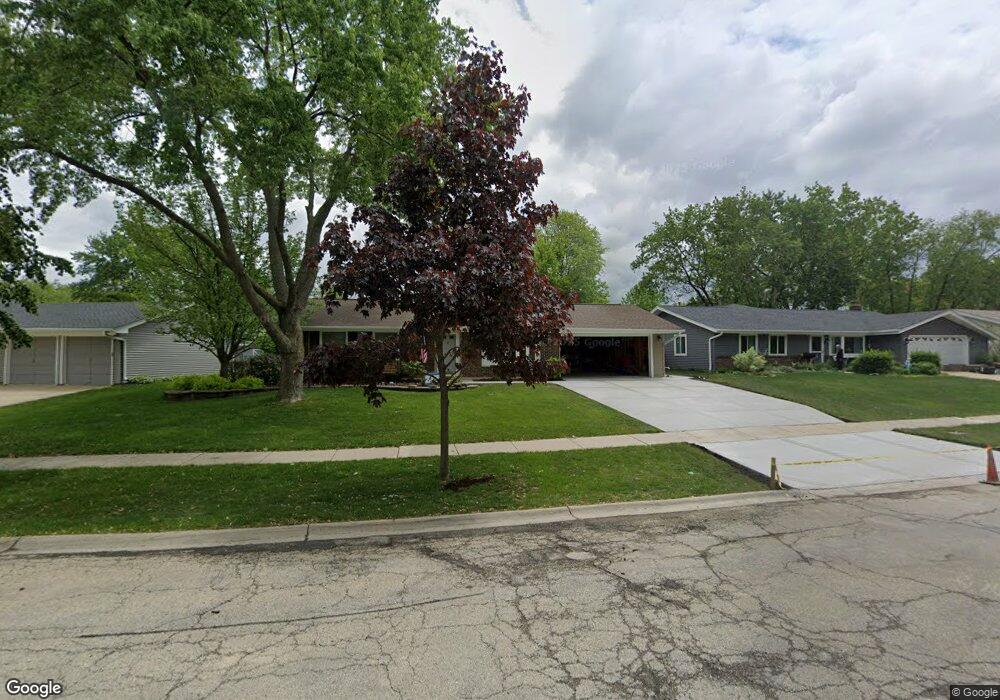
531 Grace Ln Schaumburg, IL 60193
South Schaumburg NeighborhoodEstimated Value: $385,000 - $475,000
3
Beds
2
Baths
1,440
Sq Ft
$294/Sq Ft
Est. Value
About This Home
This home is located at 531 Grace Ln, Schaumburg, IL 60193 and is currently estimated at $423,650, approximately $294 per square foot. 531 Grace Ln is a home located in Cook County with nearby schools including Edwin Aldrin Elementary School, Robert Frost Junior High School, and Schaumburg High School.
Ownership History
Date
Name
Owned For
Owner Type
Purchase Details
Closed on
Sep 25, 2019
Sold by
Hunt Jason and Hunt Sara T
Bought by
Hunt Jason R and Hunt Sara T
Current Estimated Value
Home Financials for this Owner
Home Financials are based on the most recent Mortgage that was taken out on this home.
Original Mortgage
$202,000
Outstanding Balance
$134,669
Interest Rate
3.5%
Mortgage Type
New Conventional
Estimated Equity
$288,981
Purchase Details
Closed on
Mar 16, 2005
Sold by
Griffin Timothy J and Kerulis Terri M
Bought by
Hunt Jason
Home Financials for this Owner
Home Financials are based on the most recent Mortgage that was taken out on this home.
Original Mortgage
$203,200
Interest Rate
5.67%
Mortgage Type
Unknown
Purchase Details
Closed on
Dec 10, 2002
Sold by
Rupp Edward A and Rupp Deborah L
Bought by
Griffin Timothy J and Kerulis Terri M
Home Financials for this Owner
Home Financials are based on the most recent Mortgage that was taken out on this home.
Original Mortgage
$207,100
Interest Rate
6.25%
Create a Home Valuation Report for This Property
The Home Valuation Report is an in-depth analysis detailing your home's value as well as a comparison with similar homes in the area
Home Values in the Area
Average Home Value in this Area
Purchase History
| Date | Buyer | Sale Price | Title Company |
|---|---|---|---|
| Hunt Jason R | -- | National Title Solutions Inc | |
| Hunt Jason | $258,000 | Git | |
| Griffin Timothy J | $218,000 | -- |
Source: Public Records
Mortgage History
| Date | Status | Borrower | Loan Amount |
|---|---|---|---|
| Open | Hunt Jason R | $202,000 | |
| Closed | Hunt Jason | $203,200 | |
| Previous Owner | Griffin Timothy J | $207,100 |
Source: Public Records
Tax History Compared to Growth
Tax History
| Year | Tax Paid | Tax Assessment Tax Assessment Total Assessment is a certain percentage of the fair market value that is determined by local assessors to be the total taxable value of land and additions on the property. | Land | Improvement |
|---|---|---|---|---|
| 2024 | $9,368 | $29,891 | $6,259 | $23,632 |
| 2023 | $9,056 | $36,759 | $6,259 | $30,500 |
| 2022 | $9,056 | $36,759 | $6,259 | $30,500 |
| 2021 | $7,106 | $26,774 | $4,246 | $22,528 |
| 2020 | $5,975 | $23,161 | $4,246 | $18,915 |
| 2019 | $6,056 | $26,024 | $4,246 | $21,778 |
| 2018 | $5,131 | $20,534 | $3,799 | $16,735 |
| 2017 | $5,068 | $20,534 | $3,799 | $16,735 |
| 2016 | $4,982 | $20,534 | $3,799 | $16,735 |
| 2015 | $4,588 | $17,959 | $3,352 | $14,607 |
| 2014 | $4,554 | $17,959 | $3,352 | $14,607 |
| 2013 | $4,420 | $17,959 | $3,352 | $14,607 |
Source: Public Records
Map
Nearby Homes
- 516 W Weathersfield Way
- 412 Redwood Ln
- 712 Dante Ct
- 818 Brentwood Ct
- 305 Williams Dr
- 220 Kemah Ln
- 908 Jeffery Ct
- 1027 Duxbury Ln
- 315 Ashwood Dr
- 988 Chelsea Ln
- 226 Timbercrest Dr
- 1008 Shannock Ln
- 415 Laconia Ln
- 1109 Beach Comber Dr
- 635 Limerick Ln Unit 2B
- 12 Stone Bridge Ct
- 631 Derry Ct Unit 3C
- 11 Stone Bridge Ct
- 614 Tralee Ct Unit 2-C
- 32 Hilltop Dr