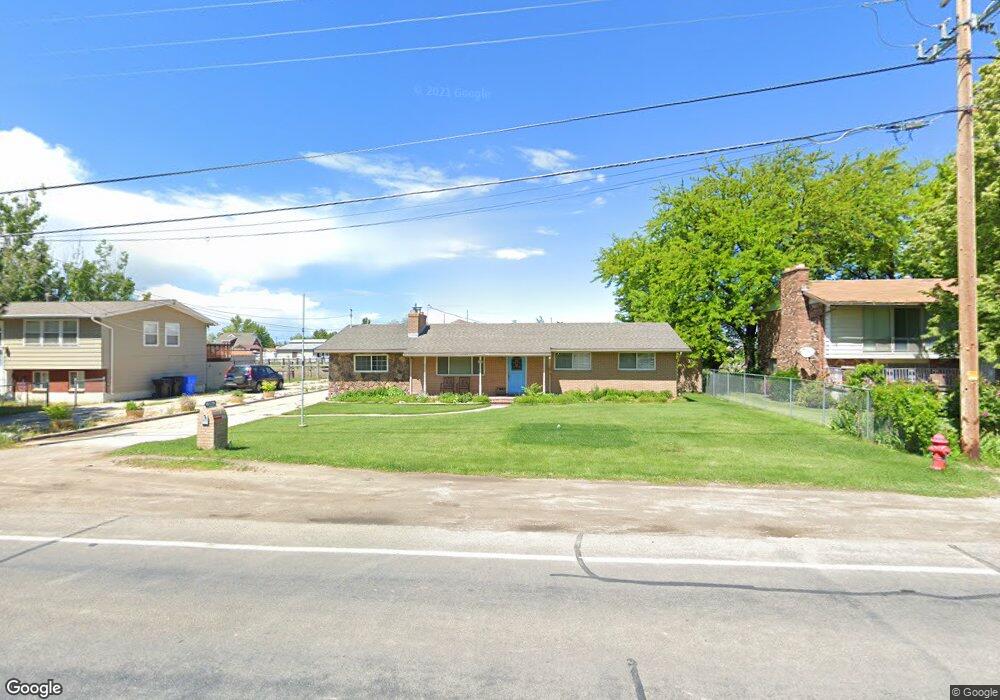
531 N 1100 W West Bountiful, UT 84087
Estimated Value: $672,000 - $1,129,000
3
Beds
1
Bath
2,560
Sq Ft
$346/Sq Ft
Est. Value
About This Home
This home is located at 531 N 1100 W, West Bountiful, UT 84087 and is currently estimated at $886,104, approximately $346 per square foot. 531 N 1100 W is a home located in Davis County with nearby schools including West Bountiful Elementary School, Bountiful Junior High School, and Viewmont High School.
Ownership History
Date
Name
Owned For
Owner Type
Purchase Details
Closed on
Feb 23, 2015
Sold by
Duggar Charles T
Bought by
Duggar Charles T and Duggar Mona
Current Estimated Value
Purchase Details
Closed on
Feb 17, 1998
Sold by
Duggar Helen
Bought by
Duggar Charles T
Create a Home Valuation Report for This Property
The Home Valuation Report is an in-depth analysis detailing your home's value as well as a comparison with similar homes in the area
Home Values in the Area
Average Home Value in this Area
Purchase History
| Date | Buyer | Sale Price | Title Company |
|---|---|---|---|
| Duggar Charles T | -- | None Available | |
| Duggar Charles T | -- | -- |
Source: Public Records
Tax History Compared to Growth
Tax History
| Year | Tax Paid | Tax Assessment Tax Assessment Total Assessment is a certain percentage of the fair market value that is determined by local assessors to be the total taxable value of land and additions on the property. | Land | Improvement |
|---|---|---|---|---|
| 2025 | $3,982 | $330,551 | $219,321 | $111,230 |
| 2024 | -- | $333,851 | $183,145 | $150,706 |
| 2023 | $3,700 | $586,000 | $326,977 | $259,023 |
| 2022 | $3,595 | $317,900 | $172,587 | $145,313 |
| 2021 | $3,289 | $445,000 | $265,449 | $179,551 |
| 2020 | $2,964 | $395,000 | $220,408 | $174,592 |
| 2019 | $2,771 | $364,000 | $203,746 | $160,254 |
| 2018 | $2,590 | $334,000 | $178,284 | $155,716 |
| 2016 | $2,154 | $151,965 | $75,912 | $76,053 |
| 2015 | $2,095 | $141,790 | $75,912 | $65,878 |
| 2014 | $2,252 | $158,979 | $75,912 | $83,067 |
| 2013 | -- | $129,869 | $48,866 | $81,003 |
Source: Public Records
Map
Nearby Homes
- 280 N 1100 W
- Carson Plan at Amberly Place
- 2050 Farmhouse Plan at Amberly Place
- Pasadena (Inactive) Plan at Amberly Place
- Portland Plan at Amberly Place
- 767 W 220 N
- 825 W 1320 N
- 1084 W Audrey Ln Unit 20
- 1084 W Audrey Ln
- 680 W 500 S Unit 22
- 680 W 500 S Unit 17
- 1075 W Audrey Ln Unit 6
- 1067 W Audrey Ln Unit 8
- 1072 W Audrey Ln Unit 17
- 1064 W Audrey Ln Unit 15
- 1056 W Audrey Ln Unit 14
- 1069 W Linden Ln Unit 31
- 988 W 1950 N Unit 134
- 340 N 500 W Unit 204
- 790 N 500 W