Estimated Value: $71,000 - $106,000
3
Beds
1
Bath
1,102
Sq Ft
$79/Sq Ft
Est. Value
About This Home
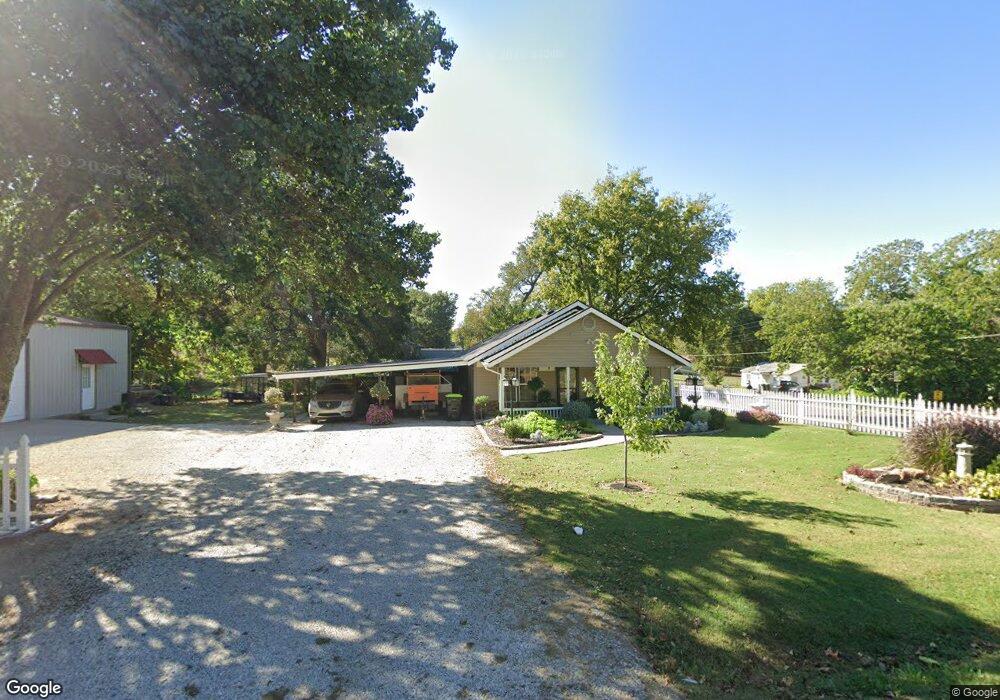
This home is located at 531 N Bluff St, Ada, OK 74820 and is currently estimated at $87,104, approximately $79 per square foot. 531 N Bluff St is a home located in Pontotoc County with nearby schools including ADA Early Childhood Center, Washington Elementary School, and Hayes Elementary School.
Ownership History
Date
Name
Owned For
Owner Type
Purchase Details
Closed on
Jan 29, 2010
Sold by
Marvin Arthur F and Marvin Gloria
Bought by
Jb Investments Llc
Current Estimated Value
Home Financials for this Owner
Home Financials are based on the most recent Mortgage that was taken out on this home.
Original Mortgage
$40,000
Interest Rate
5.16%
Mortgage Type
Credit Line Revolving
Purchase Details
Closed on
Mar 25, 2003
Sold by
John John R and John Cross
Bought by
Arthur Arthur F and Arthur Marvin
Purchase Details
Closed on
Nov 30, 1987
Bought by
Theda Conaway
Create a Home Valuation Report for This Property
The Home Valuation Report is an in-depth analysis detailing your home's value as well as a comparison with similar homes in the area
Purchase History
| Date | Buyer | Sale Price | Title Company |
|---|---|---|---|
| Jb Investments Llc | $10,000 | None Available | |
| Arthur Arthur F | $6,000 | -- | |
| Theda Conaway | $15,500 | -- |
Source: Public Records
Mortgage History
| Date | Status | Borrower | Loan Amount |
|---|---|---|---|
| Closed | Jb Investments Llc | $40,000 |
Source: Public Records
Tax History
| Year | Tax Paid | Tax Assessment Tax Assessment Total Assessment is a certain percentage of the fair market value that is determined by local assessors to be the total taxable value of land and additions on the property. | Land | Improvement |
|---|---|---|---|---|
| 2025 | $484 | $4,647 | $766 | $3,881 |
| 2024 | $461 | $4,425 | $729 | $3,696 |
| 2023 | $461 | $4,215 | $722 | $3,493 |
| 2022 | $421 | $4,014 | $648 | $3,366 |
| 2021 | $374 | $4,014 | $648 | $3,366 |
| 2020 | $286 | $2,978 | $648 | $2,330 |
| 2019 | $272 | $2,835 | $614 | $2,221 |
| 2018 | $249 | $2,700 | $582 | $2,118 |
| 2017 | $222 | $2,572 | $650 | $1,922 |
| 2016 | $209 | $2,414 | $586 | $1,828 |
| 2015 | $202 | $2,300 | $650 | $1,650 |
| 2014 | $188 | $2,300 | $650 | $1,650 |
Source: Public Records
Map
Nearby Homes
Your Personal Tour Guide
Ask me questions while you tour the home.