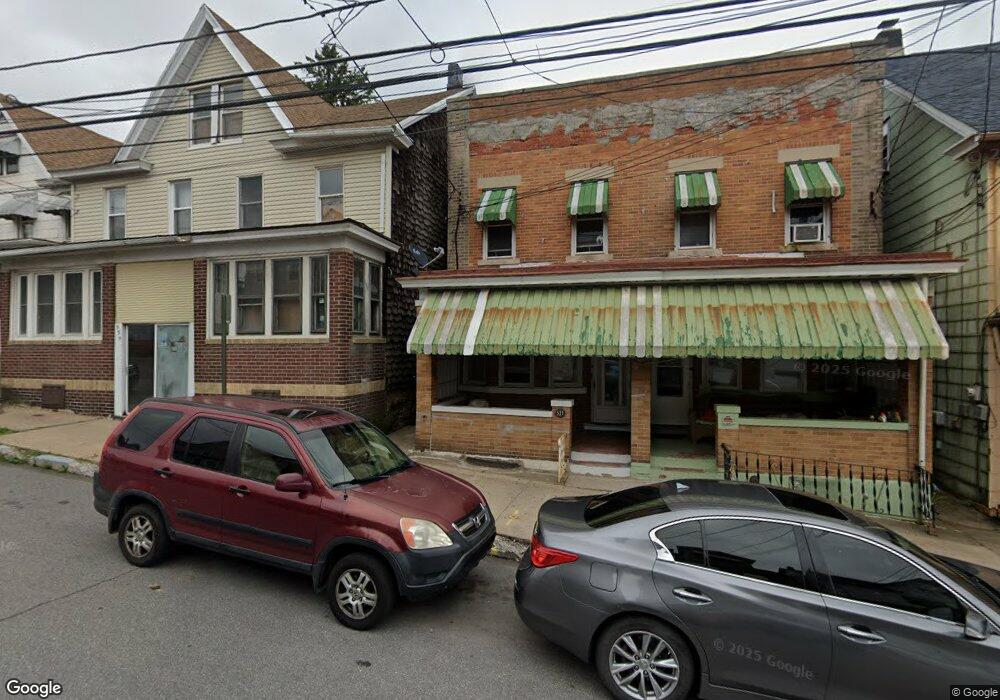
531 Seybert St Hazleton, PA 18201
Estimated Value: $162,052 - $252,000
--
Bed
--
Bath
1,806
Sq Ft
$117/Sq Ft
Est. Value
About This Home
This home is located at 531 Seybert St, Hazleton, PA 18201 and is currently estimated at $210,763, approximately $116 per square foot. 531 Seybert St is a home located in Luzerne County with nearby schools including Hazleton Area High School, Holy Family Academy, and Immanuel Christian School.
Ownership History
Date
Name
Owned For
Owner Type
Purchase Details
Closed on
Aug 4, 2022
Sold by
Rosario Rodriguez Miguel R
Bought by
Amparo Socrates Nolasco
Current Estimated Value
Home Financials for this Owner
Home Financials are based on the most recent Mortgage that was taken out on this home.
Original Mortgage
$259,218
Outstanding Balance
$248,404
Interest Rate
5.81%
Mortgage Type
New Conventional
Estimated Equity
-$37,641
Purchase Details
Closed on
May 22, 2018
Sold by
Baez Socorro
Bought by
Rodriguez Miguel R Rosario
Home Financials for this Owner
Home Financials are based on the most recent Mortgage that was taken out on this home.
Original Mortgage
$127,645
Interest Rate
5.25%
Mortgage Type
FHA
Purchase Details
Closed on
Oct 20, 2016
Sold by
Fannie Mae
Bought by
Baez Socorro
Purchase Details
Closed on
Mar 15, 2016
Sold by
Cespedes Carlos M and Vega Bernarda
Bought by
Federal National Mortgage Association
Create a Home Valuation Report for This Property
The Home Valuation Report is an in-depth analysis detailing your home's value as well as a comparison with similar homes in the area
Home Values in the Area
Average Home Value in this Area
Purchase History
| Date | Buyer | Sale Price | Title Company |
|---|---|---|---|
| Amparo Socrates Nolasco | $264,000 | None Listed On Document | |
| Rodriguez Miguel R Rosario | $130,000 | Covenant Abstract | |
| Baez Socorro | $63,500 | Attorney | |
| Federal National Mortgage Association | $1,382 | None Available |
Source: Public Records
Mortgage History
| Date | Status | Borrower | Loan Amount |
|---|---|---|---|
| Open | Amparo Socrates Nolasco | $259,218 | |
| Previous Owner | Rodriguez Miguel R Rosario | $127,645 |
Source: Public Records
Tax History Compared to Growth
Tax History
| Year | Tax Paid | Tax Assessment Tax Assessment Total Assessment is a certain percentage of the fair market value that is determined by local assessors to be the total taxable value of land and additions on the property. | Land | Improvement |
|---|---|---|---|---|
| 2025 | $1,867 | $65,000 | $20,400 | $44,600 |
| 2024 | $1,749 | $65,000 | $20,400 | $44,600 |
| 2023 | $1,635 | $65,000 | $20,400 | $44,600 |
| 2022 | $1,623 | $65,000 | $20,400 | $44,600 |
| 2021 | $1,586 | $65,000 | $20,400 | $44,600 |
| 2020 | $1,417 | $65,000 | $20,400 | $44,600 |
| 2019 | $1,462 | $65,000 | $20,400 | $44,600 |
| 2018 | $1,412 | $65,000 | $20,400 | $44,600 |
| 2017 | $2,602 | $129,900 | $20,400 | $109,500 |
| 2016 | $1,850 | $129,900 | $20,400 | $109,500 |
| 2015 | -- | $129,900 | $20,400 | $109,500 |
| 2014 | -- | $129,900 | $20,400 | $109,500 |
Source: Public Records
Map
Nearby Homes
- 538 Carson St Unit 40
- 526 Garfield St
- 589 Garfield St
- ER.126 W Aspen St
- 523 N Laurel St
- 14 W 5th St
- 127 W Diamond Ave
- 530 N Lee Ct
- 629 Arthur St
- 163 N Church St
- 90 N Cedar St
- 756 Seybert St
- 738 N Manhattan Ct
- 572 N Vine St
- 728 E 3rd St
- 515 Monges St
- 616 Monges St
- 739 N Church St
- 56 N Laurel St
- 52 N Laurel St