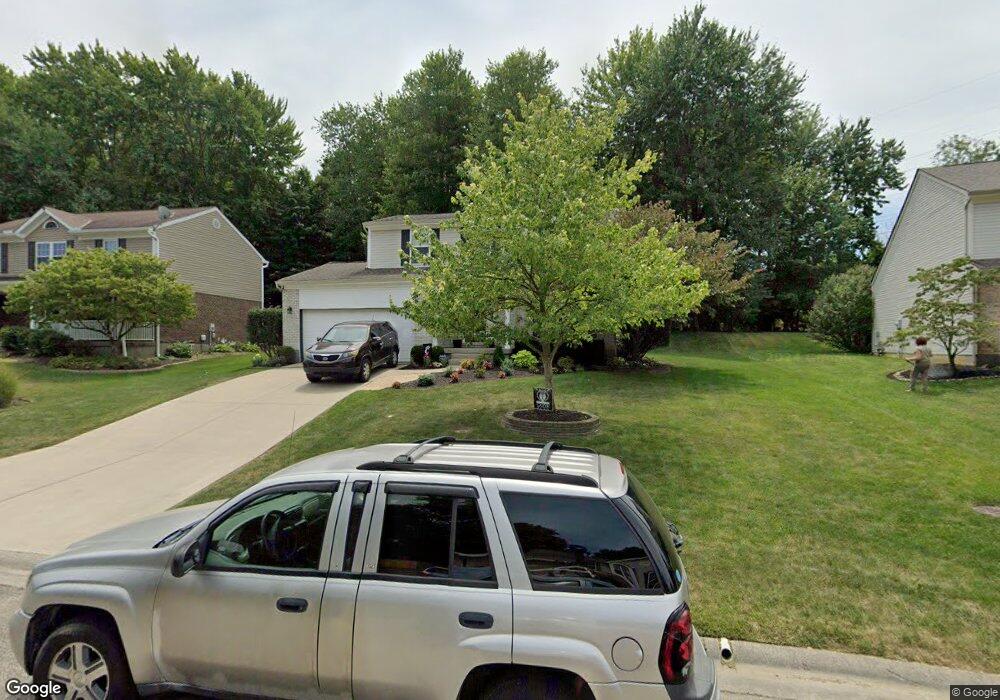
531 Sugar Maple Ct Cincinnati, OH 45255
Estimated Value: $347,000 - $355,000
3
Beds
3
Baths
1,667
Sq Ft
$210/Sq Ft
Est. Value
About This Home
This home is located at 531 Sugar Maple Ct, Cincinnati, OH 45255 and is currently estimated at $350,205, approximately $210 per square foot. 531 Sugar Maple Ct is a home located in Clermont County with nearby schools including Withamsville-Tobasco Elementary School, West Clermont Middle School, and West Clermont High School.
Ownership History
Date
Name
Owned For
Owner Type
Purchase Details
Closed on
Mar 16, 2004
Sold by
Reese Mark E and Reese Kimberly
Bought by
Crothers Christopher and Crothers Laurie A
Current Estimated Value
Purchase Details
Closed on
Apr 4, 1996
Sold by
Williamsburg Properties
Bought by
Reese Mark
Home Financials for this Owner
Home Financials are based on the most recent Mortgage that was taken out on this home.
Original Mortgage
$124,900
Interest Rate
6.88%
Mortgage Type
New Conventional
Purchase Details
Closed on
Jun 15, 1993
Create a Home Valuation Report for This Property
The Home Valuation Report is an in-depth analysis detailing your home's value as well as a comparison with similar homes in the area
Purchase History
We collect this data history from publicly available records. To have your information removed, we recommend requesting removal directly through your county’s website.
| Date | Buyer | Sale Price | Title Company |
|---|---|---|---|
| Crothers Christopher | $169,500 | -- | |
| Reese Mark | $131,500 | -- | |
| -- | $93,000 | -- |
Source: Public Records
Mortgage History
We collect this data history from publicly available records. To have your information removed, we recommend requesting removal directly through your county’s website.
| Date | Status | Borrower | Loan Amount |
|---|---|---|---|
| Closed | Reese Mark | $124,900 |
Source: Public Records
Tax History
| Year | Tax Paid | Tax Assessment Tax Assessment Total Assessment is a certain percentage of the fair market value that is determined by local assessors to be the total taxable value of land and additions on the property. | Land | Improvement |
|---|---|---|---|---|
| 2025 | $4,369 | $86,800 | $18,970 | $67,830 |
| 2024 | $4,377 | $86,800 | $18,970 | $67,830 |
| 2023 | $4,384 | $86,800 | $18,970 | $67,830 |
| 2022 | $3,914 | $67,170 | $14,700 | $52,470 |
| 2021 | $3,930 | $67,170 | $14,700 | $52,470 |
| 2020 | $3,934 | $67,170 | $14,700 | $52,470 |
| 2019 | $3,191 | $63,700 | $14,210 | $49,490 |
| 2018 | $3,224 | $63,700 | $14,210 | $49,490 |
| 2017 | $3,266 | $63,700 | $14,210 | $49,490 |
| 2016 | $2,849 | $50,970 | $11,380 | $39,590 |
| 2015 | $2,765 | $50,970 | $11,380 | $39,590 |
| 2014 | $2,765 | $50,970 | $11,380 | $39,590 |
| 2013 | $2,900 | $52,890 | $11,380 | $41,510 |
Source: Public Records
Map
Nearby Homes
- 212 Duchess Ln
- 4182 Mount Carmel Tobasco Rd
- 0 Clough Pike Unit 1861584
- 4150 Mt Carmel Tobasco Rd
- 4150 Mount Carmel Tobasco Rd
- 553 Old Orchard Dr
- 4285 Value Springs
- 537 Tradition Ridge
- 539 Tradition Ridge
- 8680 Bethany Ln
- 4182 Cannon Gate Dr
- 663 Tradition Ridge
- 4204 Cannon Gate Dr
- 1667 Clemson Cir
- 497 Tradition Ridge
- 489 Tradition Ridge
- 483 Tradition Ridge
- 499 Tradition Ridge
- 477 Tradition Ridge
- 473 Tradition Ridge
- 533 Sugar Maple Ct
- 529 Sugar Maple Ct
- 535 Sugar Maple Ct
- 527 Sugar Maple Ct
- 530 Sugar Maple Ct
- 537 Sugar Maple Ct
- 525 Sugar Maple Ct
- 534 Sugar Maple Ct
- 528 Sugar Maple Ct
- 539 Sugar Maple Ct
- 4207 Maple Dale Ln
- 523 Sugar Maple Ct
- 526 Sugar Maple Ct
- 529 Hamblin Dr
- 531 Hamblin Dr
- 541 Sugar Maple Ct
- 527 Hamblin Dr
- 524 Sugar Maple Ct
- 533 Hamblin Dr
- 4208 Maple Dale Ln
Your Personal Tour Guide
Ask me questions while you tour the home.