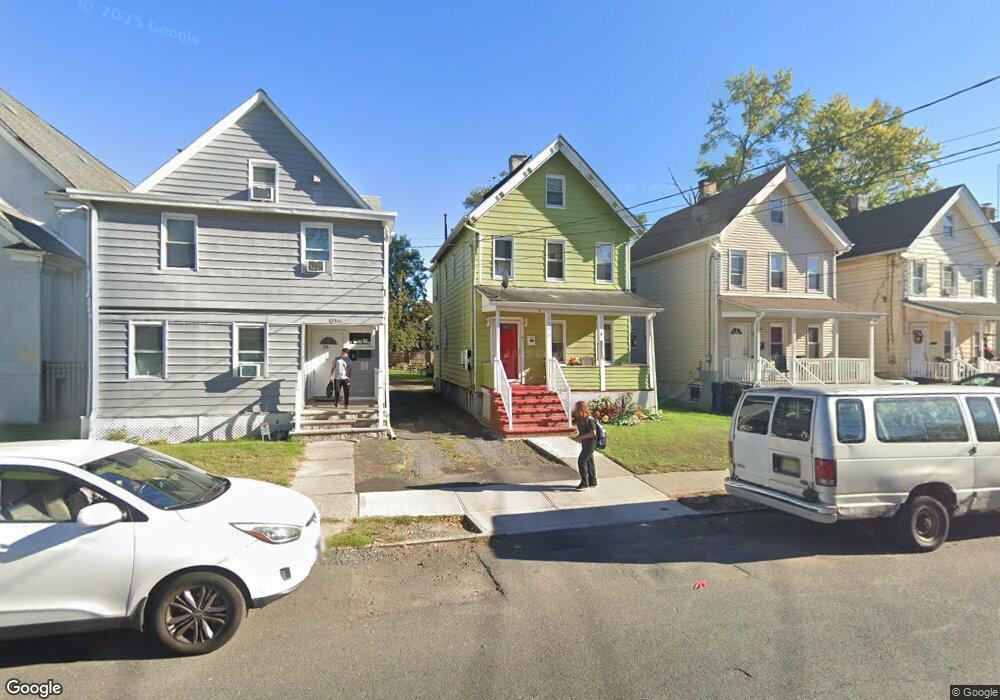
531 W 4th St Plainfield, NJ 07060
Estimated Value: $269,568 - $440,000
Studio
--
Bath
1,080
Sq Ft
$349/Sq Ft
Est. Value
About This Home
This home is located at 531 W 4th St, Plainfield, NJ 07060 and is currently estimated at $376,892, approximately $348 per square foot. 531 W 4th St is a home located in Union County with nearby schools including Cedarbrook K-8 Center, Hubbard Middle School, and Plainfield High School.
Ownership History
Date
Name
Owned For
Owner Type
Purchase Details
Closed on
Jul 11, 2001
Sold by
Bell Roy and Bell Vanessa
Bought by
Chrisp Beverly
Current Estimated Value
Home Financials for this Owner
Home Financials are based on the most recent Mortgage that was taken out on this home.
Original Mortgage
$88,600
Interest Rate
7.06%
Purchase Details
Closed on
Dec 16, 1996
Sold by
Cundiff Stuart B
Bought by
Bell Roy and Bell Vanessa
Purchase Details
Closed on
Dec 6, 1996
Sold by
Cit Group/Consumer Finance Inc
Bought by
Cundiff Stuart B
Purchase Details
Closed on
Dec 12, 1995
Sold by
Froehlich Ralph
Bought by
The Cit Group/Consumer Finance Inc
Purchase Details
Closed on
May 15, 1994
Sold by
King Dana
Bought by
Booker Darnell
Purchase Details
Closed on
Dec 27, 1993
Sold by
Beneficial New Jersey Inc
Bought by
King Dana
Create a Home Valuation Report for This Property
The Home Valuation Report is an in-depth analysis detailing your home's value as well as a comparison with similar homes in the area
Home Values in the Area
Average Home Value in this Area
Purchase History
| Date | Buyer | Sale Price | Title Company |
|---|---|---|---|
| Chrisp Beverly | $90,000 | Chicago Title Insurance Co | |
| Bell Roy | $25,000 | -- | |
| Cundiff Stuart B | $20,000 | -- | |
| The Cit Group/Consumer Finance Inc | $2,600 | -- | |
| Booker Darnell | $85,000 | First American Title Ins Co | |
| King Dana | $23,000 | First American Title Ins Co |
Source: Public Records
Mortgage History
| Date | Status | Borrower | Loan Amount |
|---|---|---|---|
| Previous Owner | Chrisp Beverly | $88,600 | |
| Closed | The Cit Group/Consumer Finance Inc | -- |
Source: Public Records
Tax History
| Year | Tax Paid | Tax Assessment Tax Assessment Total Assessment is a certain percentage of the fair market value that is determined by local assessors to be the total taxable value of land and additions on the property. | Land | Improvement |
|---|---|---|---|---|
| 2025 | $5,204 | $59,600 | $18,200 | $41,400 |
| 2024 | $5,153 | $59,600 | $18,200 | $41,400 |
| 2023 | $5,153 | $59,600 | $18,200 | $41,400 |
| 2022 | $5,042 | $59,600 | $18,200 | $41,400 |
| 2021 | $4,997 | $59,600 | $18,200 | $41,400 |
| 2020 | $4,983 | $59,600 | $18,200 | $41,400 |
| 2019 | $4,983 | $59,600 | $18,200 | $41,400 |
| 2018 | $4,879 | $59,600 | $18,200 | $41,400 |
| 2017 | $4,760 | $59,600 | $18,200 | $41,400 |
| 2016 | $4,663 | $59,600 | $18,200 | $41,400 |
| 2015 | $4,525 | $59,600 | $18,200 | $41,400 |
| 2014 | $4,402 | $59,600 | $18,200 | $41,400 |
Source: Public Records
Map
Nearby Homes
- 542 W 6th St
- 409 John St Unit 11
- 647 S 2nd St
- 614-34 W 8th St Unit 15
- 218 Muhlenberg Place Unit 20
- 600-2 Madison Ave
- 19 H Washington Ave Unit H
- 720 Madison Ave Unit 22
- 911 Plainfield Ave Unit 13
- 413 W 8th St
- 911 13 Plainfield Ave
- 700 W Front St Unit 2
- 745 W 4th St Unit 47
- 32 Washington Ave
- 301 Grant Ave Unit 3
- 211 Grant Ave
- 946 Central Ave
- 957 Central Ave Unit 63
- 944 Madison Ave Unit 46
- 401 Highway22b25u4ondo Unit 25D
- 533 W 4th St
- 529 W 4th St
- 535 W 4th St
- 537 W 4th St
- 539 W 4th St
- 534 W 5th St
- 532 W 5th St
- 536 W 5th St Unit 38
- 540 W 5th St Unit 42
- 544 W 5th St Unit 46
- 544-46 W 5th St
- 415 Plainfield Ave Unit 17
- 548 W 5th St Unit 50
- 552 W 5th St Unit 54
- 556 W 5th St Unit 60
- 321 E 3rd St Unit 525
- 321 E 3rd St Unit 320
- 321 E 3rd St Unit 202
- 321 E 3rd St Unit 228
- 321 E 3rd St Unit 421
Your Personal Tour Guide
Ask me questions while you tour the home.