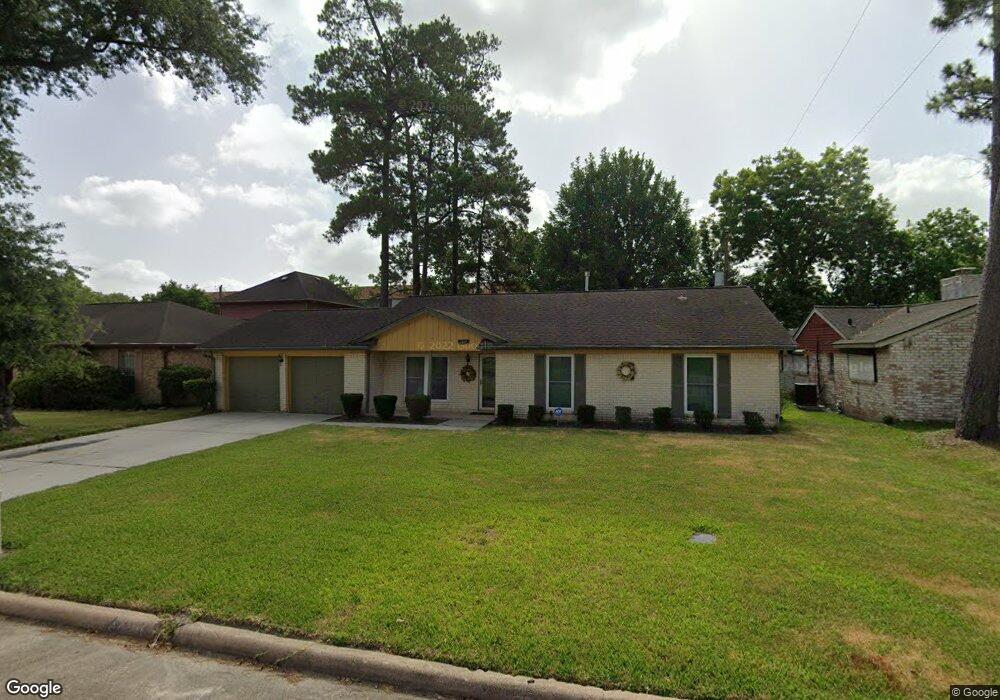
5310 Brinkman St Houston, TX 77091
Acres Homes NeighborhoodEstimated Value: $327,592 - $441,000
3
Beds
2
Baths
1,692
Sq Ft
$219/Sq Ft
Est. Value
About This Home
This home is located at 5310 Brinkman St, Houston, TX 77091 and is currently estimated at $370,398, approximately $218 per square foot. 5310 Brinkman St is a home located in Harris County with nearby schools including Highland Heights Elementary School, Williams Middle, and Booker T Washington Sr High.
Ownership History
Date
Name
Owned For
Owner Type
Purchase Details
Closed on
Nov 26, 2002
Sold by
Benson Carolyn and Baker Stephen L
Bought by
Johnson Patricia A
Current Estimated Value
Home Financials for this Owner
Home Financials are based on the most recent Mortgage that was taken out on this home.
Original Mortgage
$110,580
Outstanding Balance
$47,123
Interest Rate
6.13%
Estimated Equity
$323,275
Create a Home Valuation Report for This Property
The Home Valuation Report is an in-depth analysis detailing your home's value as well as a comparison with similar homes in the area
Home Values in the Area
Average Home Value in this Area
Purchase History
| Date | Buyer | Sale Price | Title Company |
|---|---|---|---|
| Johnson Patricia A | -- | Chicago Title Insurance Co |
Source: Public Records
Mortgage History
| Date | Status | Borrower | Loan Amount |
|---|---|---|---|
| Open | Johnson Patricia A | $110,580 |
Source: Public Records
Tax History Compared to Growth
Tax History
| Year | Tax Paid | Tax Assessment Tax Assessment Total Assessment is a certain percentage of the fair market value that is determined by local assessors to be the total taxable value of land and additions on the property. | Land | Improvement |
|---|---|---|---|---|
| 2025 | $301 | $315,780 | $130,500 | $185,280 |
| 2024 | $301 | $319,413 | $130,500 | $188,913 |
| 2023 | $301 | $308,362 | $130,500 | $177,862 |
| 2022 | $6,153 | $303,442 | $130,500 | $172,942 |
| 2021 | $5,921 | $264,931 | $130,500 | $134,431 |
| 2020 | $5,593 | $258,594 | $130,500 | $128,094 |
| 2019 | $5,313 | $250,751 | $130,500 | $120,251 |
| 2018 | $3,581 | $190,874 | $87,000 | $103,874 |
| 2017 | $4,806 | $190,874 | $87,000 | $103,874 |
| 2016 | $4,370 | $190,874 | $87,000 | $103,874 |
| 2015 | $2,773 | $181,026 | $87,000 | $94,026 |
| 2014 | $2,773 | $142,817 | $43,500 | $99,317 |
Source: Public Records
Map
Nearby Homes
- 963 Marcella St
- 710 Marcella St
- 5237 Brinkman St
- 5306 Wembley Downs Dr
- 5302 Wembley Downs Dr
- 982 W Donovan St
- 5311 Lambeth Riverside Dr
- 5323 Lambeth Riverside Dr
- Tier 1 Select Plan at Donovan Court - Tier 1 Select
- 764 W Tidwell Rd
- 5227 Brinkman Ct
- 964 Ford Pines Ln
- 5304 Wembley Downs Dr
- 5307 Lambeth Riverside Dr
- 5312 Wembley Downs Dr
- 5309 Lambeth Riverside Dr
- 968 Ford Pines Ln
- 5427 Alba Rd
- 949 Lilly Flower Ln
- 772 Davidson St
- 5306 Brinkman St
- 5314 Brinkman St
- 922 W Donovan St
- 5302 Brinkman St
- 909 Marcella St
- 5318 Brinkman St
- 5311 Brinkman St
- 5307 Brinkman St
- 5315 Brinkman St
- 5303 Brinkman St
- 5319 Brinkman St
- 943 Marcella St
- 5402 Brinkman St
- 5403 Boots Rd
- 934 W Donovan St
- 5257 Brinkman St
- 5403 Brinkman St
- 937 W Donovan St
- 947 Marcella St
- 5406 Brinkman St