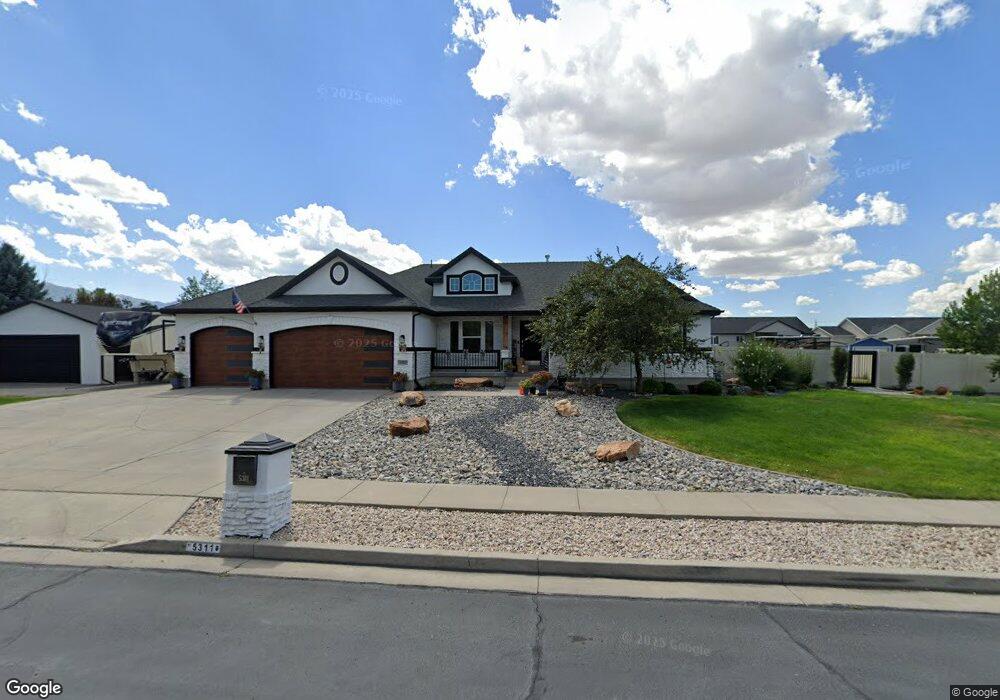
5311 Cambridge Way Tooele, UT 84074
Estimated Value: $655,000 - $795,793
--
Bed
--
Bath
4,037
Sq Ft
$185/Sq Ft
Est. Value
About This Home
This home is located at 5311 Cambridge Way, Tooele, UT 84074 and is currently estimated at $748,698, approximately $185 per square foot. 5311 Cambridge Way is a home located in Tooele County with nearby schools including Rose Springs Elementary School, Clarke N. Johnsen Junior High School, and Stansbury High School.
Ownership History
Date
Name
Owned For
Owner Type
Purchase Details
Closed on
Apr 18, 2023
Sold by
Varney Douglas J and Suazo Kerstina A
Bought by
Douglas And Kerstina Asset Protection Trust and Varney
Current Estimated Value
Purchase Details
Closed on
May 27, 2021
Sold by
Rice Virginia L
Bought by
Varney Douglas J and Suazo Kerstina A
Home Financials for this Owner
Home Financials are based on the most recent Mortgage that was taken out on this home.
Original Mortgage
$568,000
Interest Rate
2.9%
Mortgage Type
New Conventional
Purchase Details
Closed on
Nov 2, 2006
Sold by
Ivory Homes Ltd
Bought by
Rice David C and Rice Virginia L
Home Financials for this Owner
Home Financials are based on the most recent Mortgage that was taken out on this home.
Original Mortgage
$75,000
Interest Rate
6.36%
Mortgage Type
New Conventional
Create a Home Valuation Report for This Property
The Home Valuation Report is an in-depth analysis detailing your home's value as well as a comparison with similar homes in the area
Home Values in the Area
Average Home Value in this Area
Purchase History
| Date | Buyer | Sale Price | Title Company |
|---|---|---|---|
| Douglas And Kerstina Asset Protection Trust | -- | None Listed On Document | |
| Varney Douglas J | -- | Sutherland Title Company | |
| Rice David C | -- | Cottonwood Title | |
| Ivory Homes Ltd | -- | Cottonwood Title |
Source: Public Records
Mortgage History
| Date | Status | Borrower | Loan Amount |
|---|---|---|---|
| Previous Owner | Varney Douglas J | $568,000 | |
| Previous Owner | Rice David C | $75,000 |
Source: Public Records
Tax History Compared to Growth
Tax History
| Year | Tax Paid | Tax Assessment Tax Assessment Total Assessment is a certain percentage of the fair market value that is determined by local assessors to be the total taxable value of land and additions on the property. | Land | Improvement |
|---|---|---|---|---|
| 2025 | $6,280 | $793,803 | $216,800 | $577,003 |
| 2024 | $6,375 | $409,545 | $119,240 | $290,305 |
| 2023 | $6,375 | $421,909 | $119,350 | $302,559 |
| 2022 | $6,538 | $524,688 | $158,070 | $366,618 |
| 2021 | $5,106 | $338,436 | $94,820 | $243,616 |
| 2020 | $3,685 | $427,104 | $152,000 | $275,104 |
| 2019 | $3,610 | $411,567 | $152,000 | $259,567 |
| 2018 | $3,312 | $361,727 | $72,500 | $289,227 |
| 2017 | $3,012 | $347,954 | $72,500 | $275,454 |
| 2016 | $2,625 | $171,614 | $39,875 | $131,739 |
| 2015 | $2,625 | $164,729 | $0 | $0 |
| 2014 | -- | $164,729 | $0 | $0 |
Source: Public Records
Map
Nearby Homes
- 361 E Ventura Blvd
- 5229 N Ventura Cir
- 5226 N Ventura Cir
- 464 Winchester Drive'
- 5129 N Cambridge Way
- 907 W Kingfisher Rd
- 923 W Kingfisher Rd
- 5489 Hampton Way
- 5493 Lorraine Way
- 198 Clermont Ln
- 5502 Ardennes Way
- 5581 Brienne Way
- 278 E Briarwood Ln
- 5546 Ardennes Way
- 5454 Heather Way
- 5419 Heather Way
- 5634 Miller Cir
- 266 Country Club Dr
- 39 Strasbourg Ln
- 107 Pebble Beach Dr
- 5311 N Cambridge Way
- 335 E Ventura Blvd
- 327 E Ventura Blvd
- 5279 N Cambridge Way
- 315 E Ventura Blvd
- 5327 Cambridge Way
- 349 E Ventura Blvd
- 5279 Cambridge Way
- 5310 Cambridge Way
- 5318 Cambridge Way
- 5302 Cambridge Way
- 5326 Cambridge Way
- 5326 N Cambridge Way
- 317 E Ventura Blvd
- 303 E Ventura Blvd
- 5255 N Cambridge Way
- 5294 Cambridge Way
- 5294 N Cambridge Way
- 5334 Cambridge Way
- 5286 N Cambridge Way