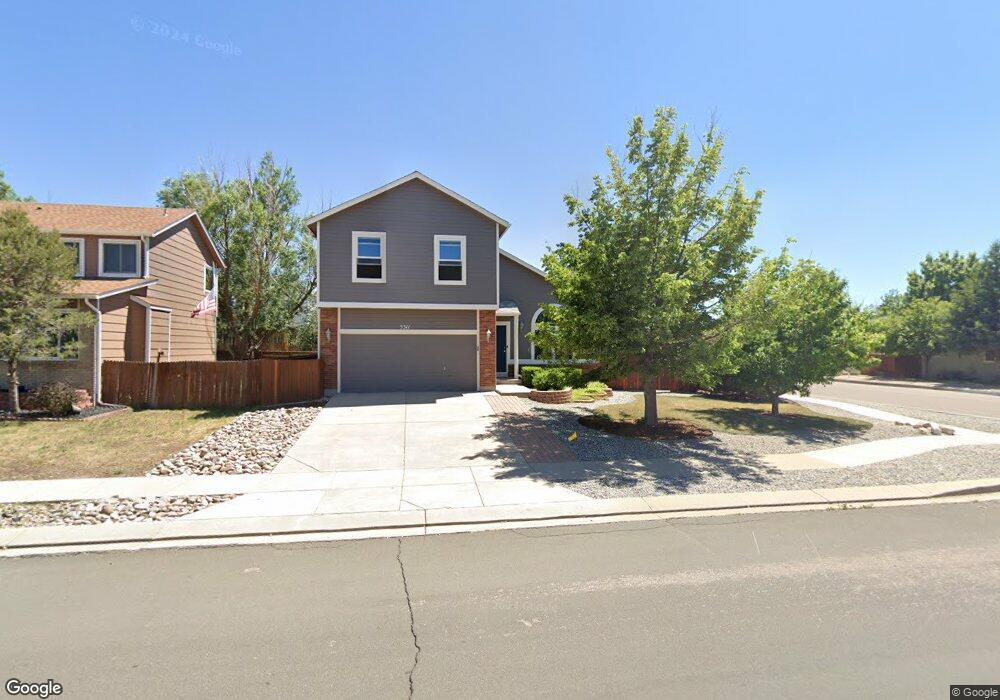
5311 Luster Dr Colorado Springs, CO 80923
Sundown NeighborhoodEstimated Value: $427,000 - $468,000
3
Beds
3
Baths
1,962
Sq Ft
$226/Sq Ft
Est. Value
About This Home
This home is located at 5311 Luster Dr, Colorado Springs, CO 80923 and is currently estimated at $442,446, approximately $225 per square foot. 5311 Luster Dr is a home located in El Paso County with nearby schools including Scott Elementary School, Jenkins Middle School, and Doherty High School.
Ownership History
Date
Name
Owned For
Owner Type
Purchase Details
Closed on
Jul 23, 2015
Sold by
Fillweber Amanda S and Fillweber Amanda
Bought by
Vercande Barbara Eve
Current Estimated Value
Home Financials for this Owner
Home Financials are based on the most recent Mortgage that was taken out on this home.
Original Mortgage
$222,888
Outstanding Balance
$177,588
Interest Rate
4.5%
Mortgage Type
FHA
Estimated Equity
$264,858
Purchase Details
Closed on
Feb 1, 2011
Sold by
Fillweber Chad Eric
Bought by
Fillweber Amanda
Purchase Details
Closed on
May 16, 2000
Sold by
Fillweber Amanda S
Bought by
Fillweber Amanda S and Fillweber Chad
Home Financials for this Owner
Home Financials are based on the most recent Mortgage that was taken out on this home.
Original Mortgage
$155,716
Interest Rate
8.19%
Mortgage Type
FHA
Create a Home Valuation Report for This Property
The Home Valuation Report is an in-depth analysis detailing your home's value as well as a comparison with similar homes in the area
Home Values in the Area
Average Home Value in this Area
Purchase History
| Date | Buyer | Sale Price | Title Company |
|---|---|---|---|
| Vercande Barbara Eve | $227,000 | Chicago Title Co | |
| Fillweber Amanda | -- | None Available | |
| Fillweber Amanda S | -- | Stewart Title | |
| Fillweber Amanda S | $157,000 | Stewart Title |
Source: Public Records
Mortgage History
| Date | Status | Borrower | Loan Amount |
|---|---|---|---|
| Open | Vercande Barbara Eve | $222,888 | |
| Previous Owner | Fillweber Amanda S | $155,716 |
Source: Public Records
Tax History Compared to Growth
Tax History
| Year | Tax Paid | Tax Assessment Tax Assessment Total Assessment is a certain percentage of the fair market value that is determined by local assessors to be the total taxable value of land and additions on the property. | Land | Improvement |
|---|---|---|---|---|
| 2025 | $1,394 | $29,220 | -- | -- |
| 2024 | $1,281 | $29,510 | $4,820 | $24,690 |
| 2023 | $1,281 | $29,510 | $4,820 | $24,690 |
| 2022 | $1,204 | $21,520 | $4,000 | $17,520 |
| 2021 | $1,306 | $22,140 | $4,110 | $18,030 |
| 2020 | $1,362 | $20,060 | $3,580 | $16,480 |
| 2019 | $1,354 | $20,060 | $3,580 | $16,480 |
| 2018 | $1,241 | $16,910 | $2,880 | $14,030 |
| 2017 | $1,175 | $16,910 | $2,880 | $14,030 |
| 2016 | $963 | $16,610 | $3,020 | $13,590 |
| 2015 | $959 | $16,610 | $3,020 | $13,590 |
| 2014 | $909 | $15,100 | $3,020 | $12,080 |
Source: Public Records
Map
Nearby Homes
- 6026 Oakwood Blvd
- 5340 Slickrock Dr
- 5551 Sunshade Point
- 5346 Sunshade Point
- 5340 Sunshade Point
- 5639 Sunshade Point
- The Gladstone Plan at Ascent at Woodmen Heights
- The Belford Plan at Ascent at Woodmen Heights
- The Crestone Plan at Ascent at Woodmen Heights
- The Elbert Plan at Ascent at Woodmen Heights
- 5127 Rushford Place
- 6556 Emerald Isle Heights
- 5185 Balsam St
- 5956 Santana Dr
- 5677 Saint Patrick View
- 5123 Stillwater Dr
- 6030 Grapevine Dr
- 5965 Corinth Dr
- 5040 Stillwater Dr
- 5940 Corinth Dr
- 5323 Luster Dr
- 5310 Paradox Dr
- 5320 Paradox Dr
- 5275 Luster Dr
- 5335 Luster Dr
- 5330 Paradox Dr
- 5312 Luster Dr
- 5290 Paradox Dr
- 5324 Luster Dr
- 5265 Luster Dr
- 5340 Paradox Dr
- 6002 Oakwood Blvd
- 5336 Luster Dr
- 5280 Paradox Dr
- 6010 Oakwood Blvd
- 5255 Luster Dr
- 5350 Paradox Dr
- 5315 Paradox Dr
- 5270 Paradox Dr
- 5325 Paradox Dr