Estimated Value: $394,000 - $425,000
4
Beds
1
Bath
1,002
Sq Ft
$408/Sq Ft
Est. Value
About This Home
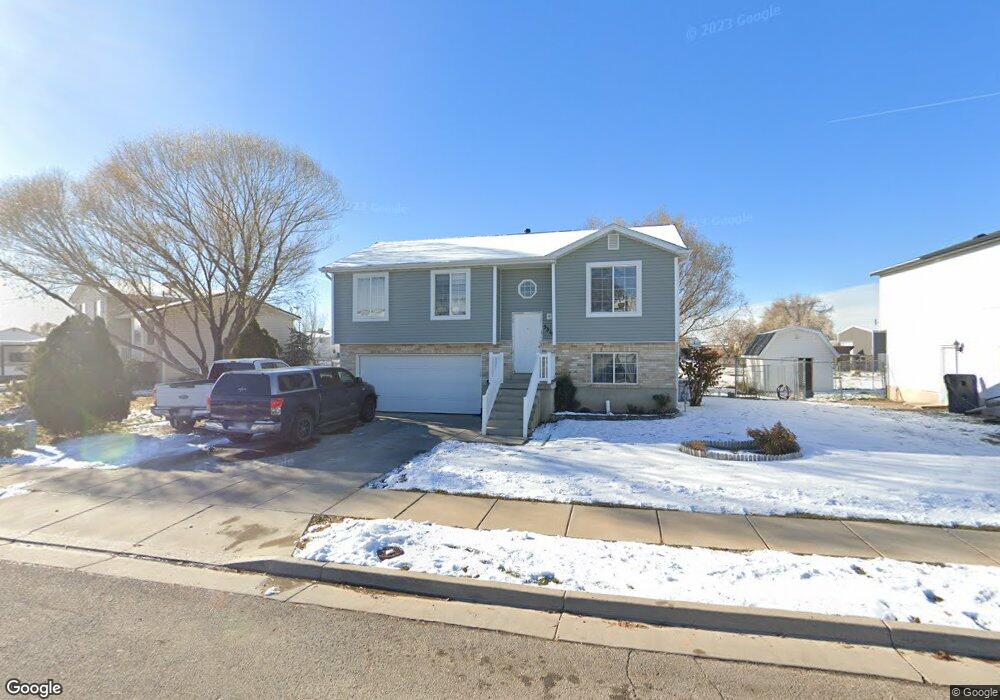
This home is located at 5311 S 4250 W, Roy, UT 84067 and is currently estimated at $408,538, approximately $407 per square foot. 5311 S 4250 W is a home located in Weber County with nearby schools including Freedom School, Roy Junior High School, and Roy High School.
Ownership History
Date
Name
Owned For
Owner Type
Purchase Details
Closed on
Oct 26, 2001
Sold by
Salcedo Jose
Bought by
Salcedo Jose and Salcedo Bertha
Current Estimated Value
Home Financials for this Owner
Home Financials are based on the most recent Mortgage that was taken out on this home.
Original Mortgage
$107,552
Outstanding Balance
$42,408
Interest Rate
6.84%
Mortgage Type
FHA
Estimated Equity
$366,130
Purchase Details
Closed on
Nov 6, 2000
Sold by
Nelson & Nelson Construction Inc
Bought by
Salcedo Jose
Home Financials for this Owner
Home Financials are based on the most recent Mortgage that was taken out on this home.
Original Mortgage
$105,418
Interest Rate
7.88%
Mortgage Type
FHA
Purchase Details
Closed on
Jul 5, 2000
Sold by
Marsell Inc
Bought by
Nelson & Nelson Construction Inc
Create a Home Valuation Report for This Property
The Home Valuation Report is an in-depth analysis detailing your home's value as well as a comparison with similar homes in the area
Home Values in the Area
Average Home Value in this Area
Purchase History
| Date | Buyer | Sale Price | Title Company |
|---|---|---|---|
| Salcedo Jose | -- | Equity Title | |
| Salcedo Jose | -- | Equity Title | |
| Salcedo Jose | -- | -- | |
| Nelson & Nelson Construction Inc | -- | -- |
Source: Public Records
Mortgage History
| Date | Status | Borrower | Loan Amount |
|---|---|---|---|
| Open | Salcedo Jose | $107,552 | |
| Closed | Salcedo Jose | $105,418 |
Source: Public Records
Tax History Compared to Growth
Tax History
| Year | Tax Paid | Tax Assessment Tax Assessment Total Assessment is a certain percentage of the fair market value that is determined by local assessors to be the total taxable value of land and additions on the property. | Land | Improvement |
|---|---|---|---|---|
| 2025 | $2,433 | $382,400 | $120,013 | $262,387 |
| 2024 | $2,375 | $206,799 | $66,007 | $140,792 |
| 2023 | $2,284 | $199,100 | $65,968 | $133,132 |
| 2022 | $2,561 | $232,650 | $57,754 | $174,896 |
| 2021 | $1,974 | $292,000 | $80,017 | $211,983 |
| 2020 | $1,921 | $262,000 | $80,017 | $181,983 |
| 2019 | $1,827 | $234,000 | $45,015 | $188,985 |
| 2018 | $1,759 | $212,000 | $42,015 | $169,985 |
| 2017 | $1,651 | $186,000 | $42,015 | $143,985 |
| 2016 | $1,558 | $94,090 | $21,415 | $72,675 |
| 2015 | $1,389 | $85,185 | $21,415 | $63,770 |
| 2014 | $1,293 | $77,616 | $18,736 | $58,880 |
Source: Public Records
Map
Nearby Homes
- 5270 S 4200 W
- 5116 S 4300 W
- 4337 W 5430 S Unit A
- 4342 W 5430 S Unit B
- 4309 W 5430 St #B S
- 4218 W 5050 S
- 5013 S 4150 W
- 4449 W 5325 S
- 5465 S 4050 W
- 5235 Midland Dr
- 5539 S 4175 W
- 4990 S 4075 W
- 4021 W 5000 S
- 4890 S 4075 W
- 4141 W 4875 S
- 4106 W 4875 S
- 5644 S 4075 W
- 4556 W 4950 S
- 3766 W 5300 S
- 4756 S 4300 W