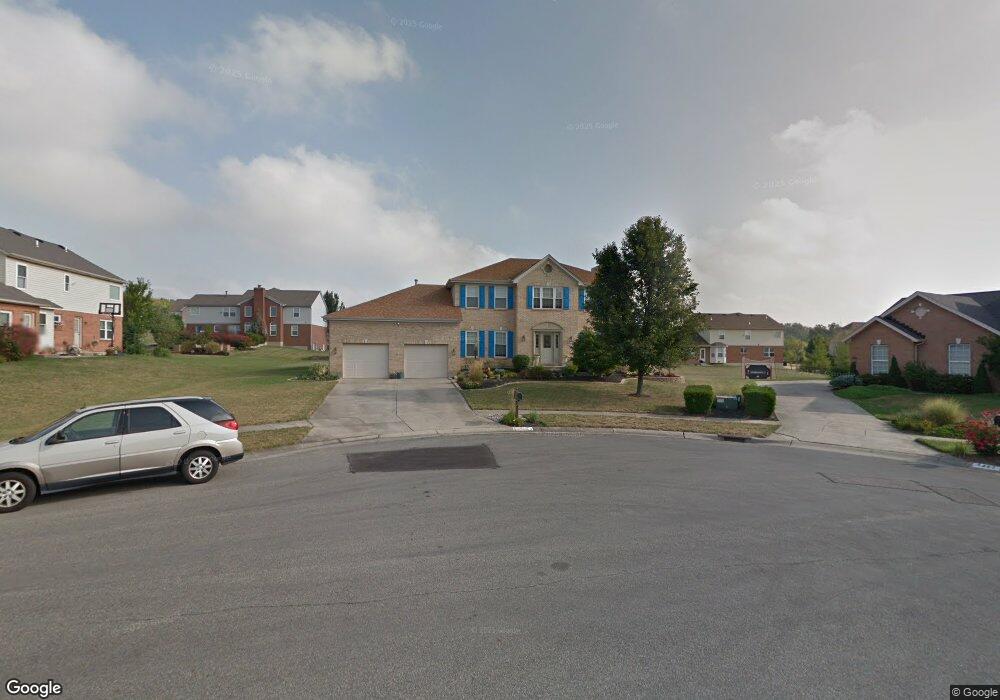
5312 Arborcrest Ct West Chester, OH 45069
West Chester Township NeighborhoodEstimated Value: $493,000 - $567,000
4
Beds
3
Baths
2,984
Sq Ft
$174/Sq Ft
Est. Value
About This Home
This home is located at 5312 Arborcrest Ct, West Chester, OH 45069 and is currently estimated at $519,265, approximately $174 per square foot. 5312 Arborcrest Ct is a home located in Butler County with nearby schools including Endeavor Elementary School, Lakota Plains Junior School, and Lakota West High School.
Ownership History
Date
Name
Owned For
Owner Type
Purchase Details
Closed on
May 10, 2014
Sold by
Herrmann Charles E and Schmitt Darla J
Bought by
Herrmann Charles E and Herrmann Darla T
Current Estimated Value
Purchase Details
Closed on
Oct 30, 1995
Sold by
Hal Homes Ltd Ptns
Bought by
Herrmann Charles E and Schmitt Darla
Home Financials for this Owner
Home Financials are based on the most recent Mortgage that was taken out on this home.
Original Mortgage
$160,300
Outstanding Balance
$2,253
Interest Rate
7.65%
Mortgage Type
New Conventional
Estimated Equity
$517,012
Purchase Details
Closed on
Jan 31, 1995
Sold by
John Henry Homes Inc
Bought by
Hal Homes Ltd
Home Financials for this Owner
Home Financials are based on the most recent Mortgage that was taken out on this home.
Original Mortgage
$1,125,000
Interest Rate
9.28%
Mortgage Type
New Conventional
Create a Home Valuation Report for This Property
The Home Valuation Report is an in-depth analysis detailing your home's value as well as a comparison with similar homes in the area
Home Values in the Area
Average Home Value in this Area
Purchase History
| Date | Buyer | Sale Price | Title Company |
|---|---|---|---|
| Herrmann Charles E | -- | None Available | |
| Herrmann Charles E | $200,380 | -- | |
| Hal Homes Ltd | $283,500 | -- |
Source: Public Records
Mortgage History
| Date | Status | Borrower | Loan Amount |
|---|---|---|---|
| Open | Herrmann Charles E | $160,300 | |
| Previous Owner | Hal Homes Ltd | $1,125,000 |
Source: Public Records
Tax History Compared to Growth
Tax History
| Year | Tax Paid | Tax Assessment Tax Assessment Total Assessment is a certain percentage of the fair market value that is determined by local assessors to be the total taxable value of land and additions on the property. | Land | Improvement |
|---|---|---|---|---|
| 2024 | $6,042 | $146,450 | $18,360 | $128,090 |
| 2023 | $6,000 | $148,340 | $18,360 | $129,980 |
| 2022 | $5,692 | $102,070 | $18,360 | $83,710 |
| 2021 | $5,172 | $98,080 | $18,360 | $79,720 |
| 2020 | $5,295 | $98,080 | $18,360 | $79,720 |
| 2019 | $4,901 | $88,110 | $17,720 | $70,390 |
| 2018 | $4,988 | $88,110 | $17,720 | $70,390 |
| 2017 | $5,077 | $88,110 | $17,720 | $70,390 |
| 2016 | $5,042 | $82,390 | $17,720 | $64,670 |
| 2015 | $5,036 | $82,390 | $17,720 | $64,670 |
| 2014 | $4,856 | $82,390 | $17,720 | $64,670 |
| 2013 | $4,856 | $77,240 | $17,720 | $59,520 |
Source: Public Records
Map
Nearby Homes
- 7392 Wheatland Meadow Ct
- 7712 Whitehall Cir E
- 5577 Dove Ln
- 8330 Park Place
- 5671 Tylersville Rd
- 8135 Timbertree Way Unit 3
- 7690 Wharton Ct
- 5663 E Senour Dr
- 8050 Tollbridge Ct
- 5241 Hamilton Mason Rd
- 7904 Woodglen Dr
- 5677 E Senour Dr
- 7213 Quail Run Dr
- 5365 Leaf Back Dr
- 5396 Leatherwood Dr
- 5716 E Senour Dr
- 7644 Eleventh Hour Ln
- 0 Walnut Creek Dr Unit 1850153
- 7956 Bobtail Ct
- 7229 W Hartford Ct
- 5302 Arborcrest Ct
- 5322 Arborcrest Ct
- 5311 Senour Dr
- 7588 Huntsman Ln
- 5323 Senour Dr
- 7581 Huntsman Ln Unit 163
- 5303 Arborcrest Ct
- 7697 Old Walnut Dr
- 5332 Arborcrest Ct
- 5313 Arborcrest Ct
- 7705 Old Walnut Dr
- 7689 Old Walnut Dr
- 7601 Huntsman Ln
- 7591 Huntsman Ln
- 7591 Huntsman Ln Unit 167
- 5277 Senour Dr
- 7628 Huntsman Ln
- 7611 Huntsman Ln
- 7715 Old Walnut Dr
- 5306 Senour Dr