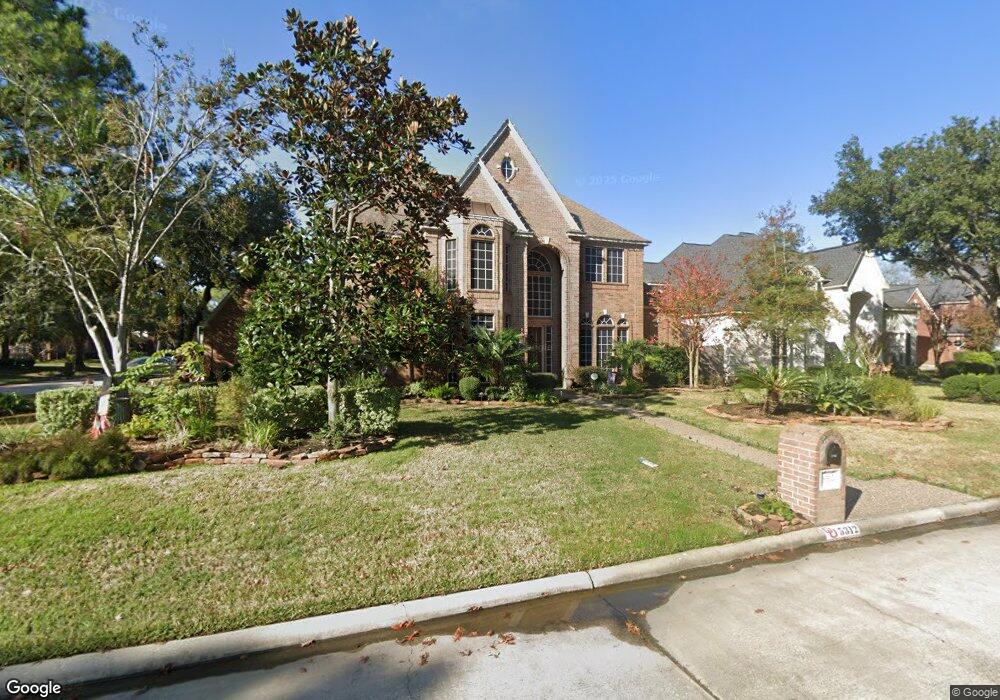
5312 Mountain Grove Ct Spring, TX 77379
Estimated Value: $531,433 - $596,000
4
Beds
4
Baths
3,980
Sq Ft
$141/Sq Ft
Est. Value
About This Home
This home is located at 5312 Mountain Grove Ct, Spring, TX 77379 and is currently estimated at $561,358, approximately $141 per square foot. 5312 Mountain Grove Ct is a home located in Harris County with nearby schools including Kuehnle Elementary School, Kleb Intermediate School, and Klein High School.
Ownership History
Date
Name
Owned For
Owner Type
Purchase Details
Closed on
Jul 27, 2009
Sold by
Zebrowski Michael W and Zebrowski Sue Carol
Bought by
Pool Anthony Neal and Pool Melinda Ann
Current Estimated Value
Home Financials for this Owner
Home Financials are based on the most recent Mortgage that was taken out on this home.
Original Mortgage
$162,500
Outstanding Balance
$107,027
Interest Rate
5.41%
Mortgage Type
Purchase Money Mortgage
Estimated Equity
$454,331
Purchase Details
Closed on
Mar 17, 1997
Sold by
Almar Homes Inc
Bought by
Zebrowski Michael W
Home Financials for this Owner
Home Financials are based on the most recent Mortgage that was taken out on this home.
Original Mortgage
$208,000
Interest Rate
7.74%
Purchase Details
Closed on
Feb 23, 1995
Sold by
First Nationwide Bank Fsb
Bought by
Almar Homes Inc
Home Financials for this Owner
Home Financials are based on the most recent Mortgage that was taken out on this home.
Original Mortgage
$250,000
Interest Rate
9.13%
Mortgage Type
Purchase Money Mortgage
Create a Home Valuation Report for This Property
The Home Valuation Report is an in-depth analysis detailing your home's value as well as a comparison with similar homes in the area
Home Values in the Area
Average Home Value in this Area
Purchase History
| Date | Buyer | Sale Price | Title Company |
|---|---|---|---|
| Pool Anthony Neal | -- | First American Title | |
| Zebrowski Michael W | -- | Heritage Title Company | |
| Almar Homes Inc | -- | Heritage Title Company |
Source: Public Records
Mortgage History
| Date | Status | Borrower | Loan Amount |
|---|---|---|---|
| Open | Pool Anthony Neal | $162,500 | |
| Previous Owner | Zebrowski Michael W | $208,000 | |
| Previous Owner | Almar Homes Inc | $250,000 |
Source: Public Records
Tax History Compared to Growth
Tax History
| Year | Tax Paid | Tax Assessment Tax Assessment Total Assessment is a certain percentage of the fair market value that is determined by local assessors to be the total taxable value of land and additions on the property. | Land | Improvement |
|---|---|---|---|---|
| 2025 | $9,191 | $503,941 | $81,722 | $422,219 |
| 2024 | $9,191 | $481,041 | $67,301 | $413,740 |
| 2023 | $9,191 | $516,755 | $67,301 | $449,454 |
| 2022 | $10,434 | $473,240 | $67,301 | $405,939 |
| 2021 | $10,095 | $388,775 | $52,879 | $335,896 |
| 2020 | $10,238 | $380,770 | $52,879 | $327,891 |
| 2019 | $10,206 | $367,295 | $52,879 | $314,416 |
| 2018 | $4,558 | $343,761 | $52,879 | $290,882 |
| 2017 | $9,601 | $343,761 | $52,879 | $290,882 |
| 2016 | $10,618 | $380,185 | $52,879 | $327,306 |
| 2015 | $8,724 | $380,185 | $52,879 | $327,306 |
| 2014 | $8,724 | $344,750 | $52,879 | $291,871 |
Source: Public Records
Map
Nearby Homes
- 5311 Valleyview Creek Ct
- 18702 Mountain Spring Dr
- 5414 Mountain View Creek Ct
- 18921 Mountain Spring Dr
- 18414 Bull Pine Dr
- 18811 Tomato St Unit 1
- Plan 264 at Creekwood Crossing
- Plan 217 at Creekwood Crossing
- Plan 210 at Creekwood Crossing
- Plan 270 at Creekwood Crossing
- Plan 218 at Creekwood Crossing
- Plan 265 at Creekwood Crossing
- Plan 269 at Creekwood Crossing
- Plan 262 at Creekwood Crossing
- Plan 209 at Creekwood Crossing
- Plan 254 at Creekwood Crossing
- Ironwood II Plan at Trinity Grove
- Olive III Plan at Trinity Grove
- Cottonwood II Plan at Trinity Grove
- Sequoia II Plan at Trinity Grove
- 5308 Mountain Grove Ct
- 5315 Valleyview Creek Ct
- 18607 Forest Bend Creek Way
- 5311 Mountain Grove Ct
- 5315 Mountain Grove Ct
- 18615 Forest Bend Creek Way
- 5319 Mountain Grove Ct
- 5307 Valleyview Creek Ct
- 5307 Mountain Grove Ct
- 5302 Mountain Grove Ct
- 18703 Forest Bend Creek Way
- 5323 Mountain Grove Ct
- 5303 Mountain Grove Ct
- 5314 Valleyview Creek Ct
- 5303 Valleyview Creek Ct
- 5310 Valleyview Creek Ct
- 18606 Mountain Spring Dr
- 18610 Mountain Spring Dr
- 18707 Forest Bend Creek Way
- 18614 Mountain Spring Dr