Estimated Value: $319,000 - $323,000
3
Beds
2
Baths
1,236
Sq Ft
$260/Sq Ft
Est. Value
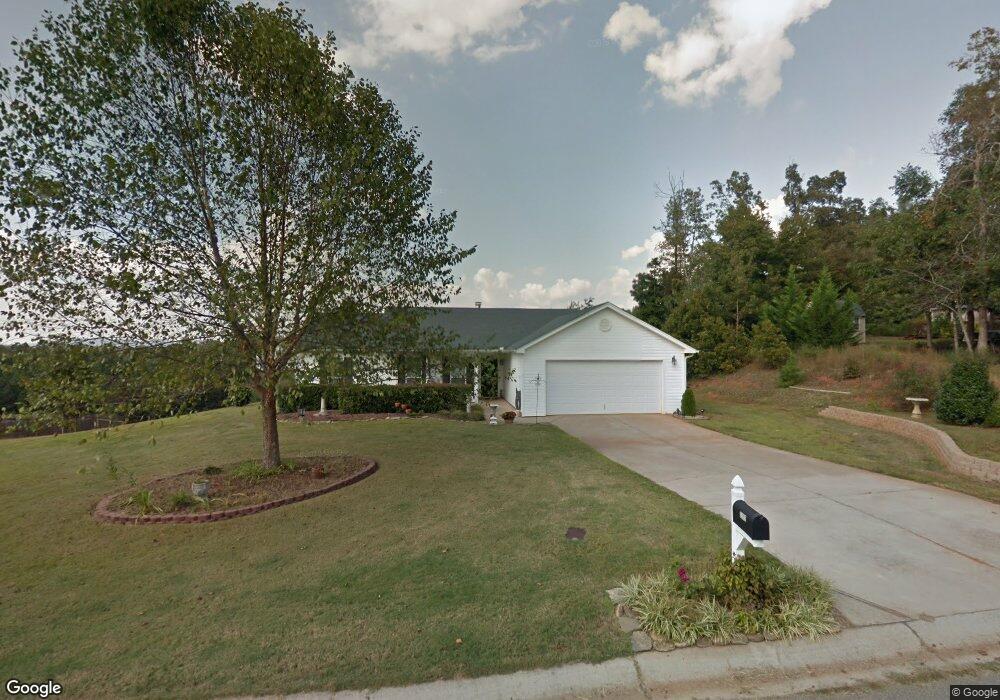
About This Home
This home is located at 5312 Skyland Ct Unit na, Lula, GA 30554 and is currently estimated at $321,656, approximately $260 per square foot. 5312 Skyland Ct Unit na is a home located in Hall County with nearby schools including Lula Elementary School, East Hall Middle School, and East Hall High School.
Ownership History
Date
Name
Owned For
Owner Type
Purchase Details
Closed on
Sep 30, 2019
Sold by
Matheson Chesley Benjamin
Bought by
Becker James M
Current Estimated Value
Purchase Details
Closed on
Oct 24, 2007
Sold by
Matheson Jonnie Maranda
Bought by
Matheson Jonnie Maranda and Chelsey Benja
Purchase Details
Closed on
Jun 26, 2006
Sold by
Manintu Wichian
Bought by
Matheson Jonnie M
Home Financials for this Owner
Home Financials are based on the most recent Mortgage that was taken out on this home.
Original Mortgage
$98,950
Interest Rate
7%
Mortgage Type
New Conventional
Purchase Details
Closed on
Dec 6, 2004
Sold by
Southfork Homes Inc
Bought by
Manintu Wichian
Home Financials for this Owner
Home Financials are based on the most recent Mortgage that was taken out on this home.
Original Mortgage
$109,950
Interest Rate
5.66%
Mortgage Type
New Conventional
Purchase Details
Closed on
Jan 15, 2004
Sold by
Dac Enterprises Inc
Bought by
Southfork Homes Inc
Create a Home Valuation Report for This Property
The Home Valuation Report is an in-depth analysis detailing your home's value as well as a comparison with similar homes in the area
Home Values in the Area
Average Home Value in this Area
Purchase History
| Date | Buyer | Sale Price | Title Company |
|---|---|---|---|
| Becker James M | $171,000 | -- | |
| Becker James M | $171,000 | -- | |
| Matheson Jonnie Maranda | -- | -- | |
| Matheson Jonnie Maranda | -- | -- | |
| Matheson Jonnie M | $124,000 | -- | |
| Matheson Jonnie M | $124,000 | -- | |
| Manintu Wichian | $115,800 | -- | |
| Manintu Wichian | $115,800 | -- | |
| Southfork Homes Inc | -- | -- | |
| Southfork Homes Inc | -- | -- |
Source: Public Records
Mortgage History
| Date | Status | Borrower | Loan Amount |
|---|---|---|---|
| Previous Owner | Matheson Jonnie M | $98,950 | |
| Previous Owner | Manintu Wichian | $109,950 |
Source: Public Records
Tax History Compared to Growth
Tax History
| Year | Tax Paid | Tax Assessment Tax Assessment Total Assessment is a certain percentage of the fair market value that is determined by local assessors to be the total taxable value of land and additions on the property. | Land | Improvement |
|---|---|---|---|---|
| 2025 | $2,628 | $114,640 | $21,280 | $93,360 |
| 2024 | $2,779 | $112,640 | $19,000 | $93,640 |
| 2023 | $2,846 | $110,760 | $19,000 | $91,760 |
| 2022 | $1,991 | $78,080 | $14,000 | $64,080 |
| 2021 | $1,952 | $75,240 | $10,800 | $64,440 |
| 2020 | $1,818 | $68,320 | $10,000 | $58,320 |
| 2019 | $1,519 | $56,920 | $8,000 | $48,920 |
| 2018 | $1,421 | $51,720 | $8,000 | $43,720 |
| 2017 | $1,482 | $52,600 | $8,000 | $44,600 |
| 2016 | $1,235 | $45,200 | $8,000 | $37,200 |
| 2015 | $1,067 | $39,036 | $4,000 | $35,036 |
| 2014 | $1,067 | $39,036 | $4,000 | $35,036 |
Source: Public Records
Map
Nearby Homes
- 5107 Mountain View Pkwy
- 5214 Happy Hollow Ct
- 6668 Belton Bridge Rd
- 6964 Wheeler Rd
- 6805 Belton Bridge Place
- 0 Barefoot Rd Unit 7594746
- 4920 Cornelia Hwy
- 6713 E Wind Dr
- 131 Dr
- 131 Caudell Dr
- 0 Barefoot Cir Unit 10616985
- 0 Caudell Dr Unit 7642531
- 0 Caudell Dr Unit 10596149
- 125 Iron Horse Trail
- 142 Hampton St
- 6455 Main St
- 163 Brookside Dr
- 6253 Main St
- 4737 Cornelia Hwy
- 5867 Main St
- 5312 Skyland Ct
- 5316 Skyland Ct
- 5304 Skyland Ct Unit na
- 5304 Skyland Ct
- 5308 Mountain View Pkwy
- 5311 Skyland Ct
- 5320 Skyland Ct
- 5307 Skyland Ct
- 5315 Skyland Ct Unit na
- 0 Mountain View Pkwy Unit 7503309
- 0 Mountain View Pkwy Unit 10433442
- 0 Mountain View Pkwy Unit 7111946
- 0 Mountain View Pkwy Unit 8587624
- 0 Mountain View Pkwy Unit 8373289
- 0 Mountain View Pkwy Unit 7641788
- 0 Mountain View Pkwy Unit 8826827
- 0 Mountain View Pkwy Unit 8826494
- 0 Mountain View Pkwy Unit 3273576
- 0 Mountain View Pkwy
- 5319 Skyland Ct Unit na