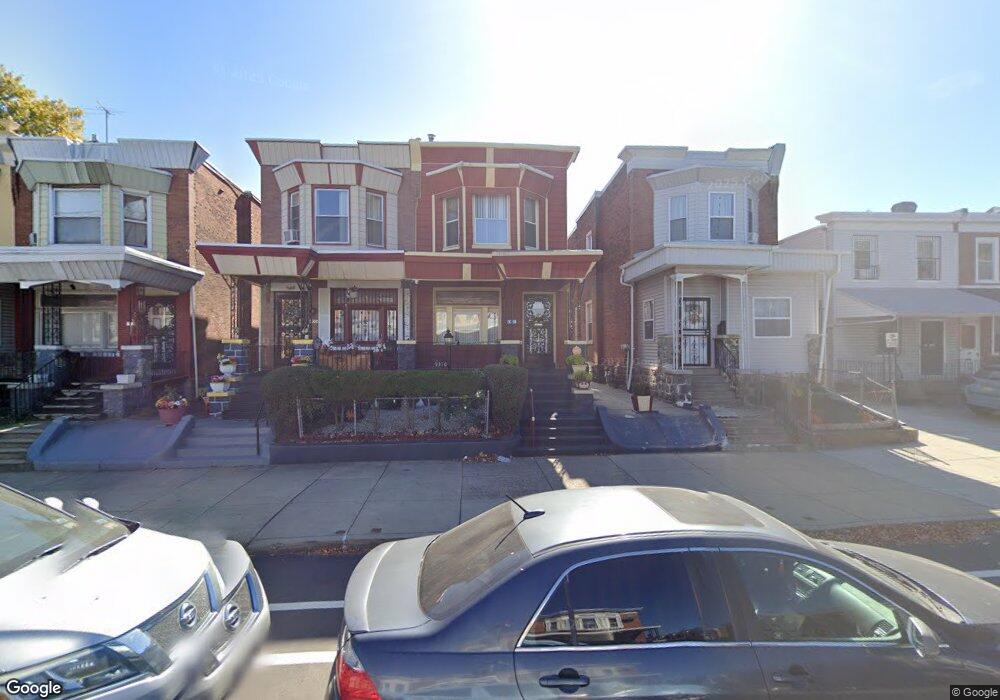
5312 Walnut St Philadelphia, PA 19139
Cobbs Creek NeighborhoodEstimated Value: $188,000 - $289,000
3
Beds
1
Bath
1,500
Sq Ft
$162/Sq Ft
Est. Value
About This Home
This home is located at 5312 Walnut St, Philadelphia, PA 19139 and is currently estimated at $243,283, approximately $162 per square foot. 5312 Walnut St is a home located in Philadelphia County with nearby schools including Fort Belvoir Elementary School, William L. Sayre High School, and Global Leadership Academy Charter School Southwest.
Ownership History
Date
Name
Owned For
Owner Type
Purchase Details
Closed on
Dec 9, 2024
Sold by
Mlujahideen Masjid
Bought by
Johnson Carmella M
Current Estimated Value
Purchase Details
Closed on
Dec 13, 2020
Sold by
Progressive Communities
Bought by
Mujahideen Masjid
Purchase Details
Closed on
Sep 1, 2014
Sold by
Philadelphia Redevelopment Authority
Bought by
Progressive Communities Cdc
Purchase Details
Closed on
Apr 2, 2014
Sold by
City Of Philadelphia
Bought by
Philadelphia Redevelopment Authority and The Redevelopment Authority
Purchase Details
Closed on
Jun 30, 2008
Sold by
Olney Associates
Bought by
City Of Philadelphia
Purchase Details
Closed on
May 28, 2008
Sold by
Branham Morris
Bought by
City Of Philadelphia
Create a Home Valuation Report for This Property
The Home Valuation Report is an in-depth analysis detailing your home's value as well as a comparison with similar homes in the area
Home Values in the Area
Average Home Value in this Area
Purchase History
| Date | Buyer | Sale Price | Title Company |
|---|---|---|---|
| Johnson Carmella M | -- | None Listed On Document | |
| Mujahideen Masjid | -- | None Available | |
| Progressive Communities Cdc | $10,654 | None Available | |
| Philadelphia Redevelopment Authority | -- | None Available | |
| City Of Philadelphia | $800 | None Available | |
| City Of Philadelphia | $800 | None Available |
Source: Public Records
Tax History Compared to Growth
Tax History
| Year | Tax Paid | Tax Assessment Tax Assessment Total Assessment is a certain percentage of the fair market value that is determined by local assessors to be the total taxable value of land and additions on the property. | Land | Improvement |
|---|---|---|---|---|
| 2026 | $1,985 | $175,900 | $35,180 | $140,720 |
| 2025 | $1,985 | $175,900 | $35,180 | $140,720 |
| 2024 | $1,985 | $175,900 | $35,180 | $140,720 |
| 2023 | $1,985 | $141,800 | $28,360 | $113,440 |
| 2022 | $1,240 | $141,800 | $28,360 | $113,440 |
| 2021 | $1,240 | $0 | $0 | $0 |
| 2020 | $1,240 | $0 | $0 | $0 |
| 2019 | $1,197 | $0 | $0 | $0 |
| 2018 | $1,110 | $0 | $0 | $0 |
| 2017 | $1,110 | $0 | $0 | $0 |
| 2016 | $1,110 | $0 | $0 | $0 |
| 2015 | $1,063 | $0 | $0 | $0 |
| 2014 | -- | $79,300 | $8,908 | $70,392 |
| 2012 | -- | $9,504 | $3,111 | $6,393 |
Source: Public Records
Map
Nearby Homes
- 5310 Walnut St
- 5309 Chancellor St
- 5330 Chancellor St
- 5250 Walnut St
- 5235 Walnut St
- 5341 Locust St
- 4622-4624 Sansom St
- 5418 Walnut St
- 5215 Locust St
- 5231 Sansom St
- 5424 Walnut St
- 5229 Irving St
- 5341 Chestnut St
- 34 S 53rd St
- 5427 Irving St
- 5418 Irving St
- 5223 Spruce St
- 268 S 52nd St
- 5415 Spruce St
- 257 S 52nd St
- 5314 Walnut St
- 5308 Walnut St
- 5306 Walnut St
- 5316 Walnut St
- 5318 Walnut St
- 5304 Walnut St
- 5313 Chancellor St
- 5320 Walnut St
- 5311 Chancellor St
- 5307 Chancellor St Unit 2
- 5302 Walnut St
- 5315-17 Chancellor St
- 5315 Chancellor St
- 5321 Chancellor St
- 5315 17 Chancellor St
- 5322 Walnut St
- 206 S 53rd St
- 206 S 53rd St Unit 1
- 206 S 53rd St Unit 2
- 208 S 53rd St