
Landlord's Agent in 2016
Yu Zhang
Realty Resources ATL, Inc.
(678) 707-2005
2 in this area
35 Total Sales
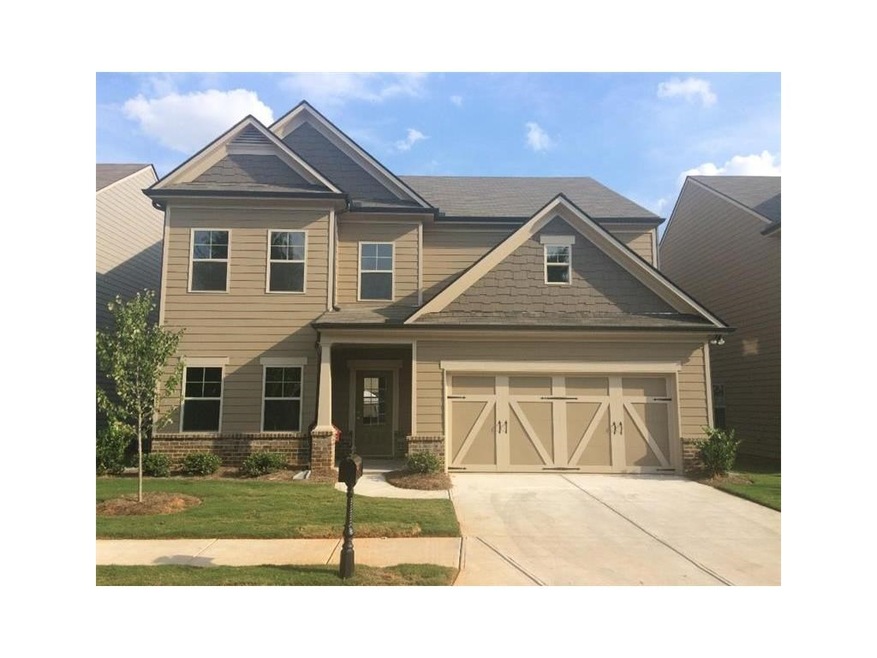
Estimated Value: $401,897 - $431,000
This home is located at 5313 Catrina Way, Buford, GA 30519 since 22 February 2016 and is currently priced at $413,974. This property was built in 2016. 5313 Catrina Way is a home located in Gwinnett County with nearby schools including Duncan Creek Elementary School, Frank N. Osborne Middle School, and Mill Creek High School.
Last Agent to Rent the Property
Realty Resources ATL, Inc. License #253606 Listed on: 02/22/2016
| Date | Buyer | Sale Price | Title Company |
|---|---|---|---|
| Wang Kun | $215,822 | -- | |
| Cmh Parks Inc | $1,594,276 | -- | |
| Willow Leaf Builders Llc | $70,000 | -- | |
| Bcr Investments Llc | $3,340,000 | -- |
| Date | Event | Price | List to Sale | Price per Sq Ft | Prior Sale |
|---|---|---|---|---|---|
| 04/19/2016 04/19/16 | Rented | $1,590 | 0.0% | -- | |
| 03/07/2016 03/07/16 | Price Changed | $1,590 | -3.6% | -- | |
| 02/22/2016 02/22/16 | For Rent | $1,650 | 0.0% | -- | |
| 02/19/2016 02/19/16 | Sold | $215,822 | -1.5% | -- | View Prior Sale |
| 01/22/2016 01/22/16 | Pending | -- | -- | -- | |
| 12/01/2015 12/01/15 | For Sale | $219,072 | -- | -- |
| Year | Tax Paid | Tax Assessment Tax Assessment Total Assessment is a certain percentage of the fair market value that is determined by local assessors to be the total taxable value of land and additions on the property. | Land | Improvement |
|---|---|---|---|---|
| 2024 | $6,562 | $176,200 | $33,200 | $143,000 |
| 2023 | $6,562 | $184,880 | $33,200 | $151,680 |
| 2022 | $0 | $157,520 | $30,800 | $126,720 |
| 2021 | $4,326 | $112,120 | $21,120 | $91,000 |
| 2020 | $4,037 | $103,480 | $19,600 | $83,880 |
| 2019 | $3,891 | $103,480 | $19,600 | $83,880 |
| 2018 | $3,595 | $94,920 | $16,800 | $78,120 |
| 2016 | $3,243 | $86,080 | $14,000 | $72,080 |
| 2015 | $352 | $9,720 | $9,720 | $0 |
| 2014 | -- | $7,520 | $7,520 | $0 |
Landlord's Agent in 2016
Yu Zhang
Realty Resources ATL, Inc.
(678) 707-2005
2 in this area
35 Total Sales
Seller's Agent in 2016
Tamra Wade
RE/MAX
(678) 899-1623
14 in this area
2,829 Total Sales
Seller Co-Listing Agent in 2016
Leslie Montgomery
Chafin Realty, Inc.
(770) 831-0844
64 in this area
312 Total Sales
A
Buyer's Agent in 2016
Ashley Zhang
Atlanta Realty International
Source: First Multiple Listing Service (FMLS)
MLS Number: 5650607
APN: 3-007-503
Disclaimer: Certain information contained herein is derived from information provided by parties other than Homes.com. All information provided is deemed reliable, but is not guaranteed to be accurate and should be independently verified.
![]() Listings identified with the FMLS IDX logo come from FMLS and are held by brokerage firms other than the owner of this website. The listing brokerage is identified in any listing details. Information is deemed reliable but is not guaranteed. If you believe any FMLS listing contains material that infringes your copyrighted work please visit www.fmls.com/dmca to review our DMCA policy and learn how to submit a takedown request. © 2025 First Multiple Listing Service, Inc.
Listings identified with the FMLS IDX logo come from FMLS and are held by brokerage firms other than the owner of this website. The listing brokerage is identified in any listing details. Information is deemed reliable but is not guaranteed. If you believe any FMLS listing contains material that infringes your copyrighted work please visit www.fmls.com/dmca to review our DMCA policy and learn how to submit a takedown request. © 2025 First Multiple Listing Service, Inc.