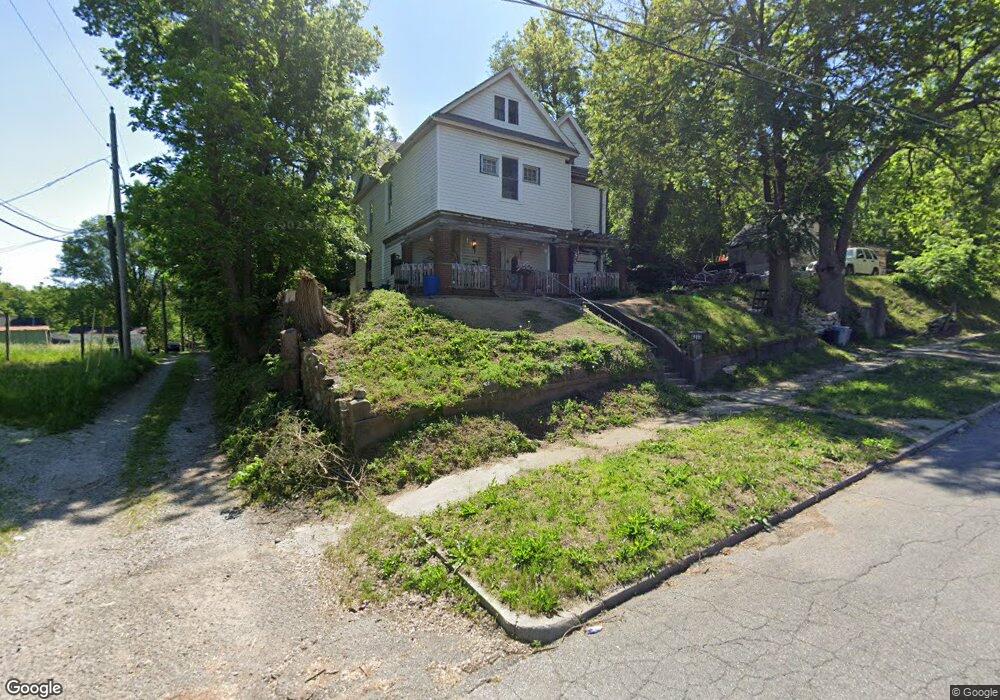
5313 S 2nd St Saint Joseph, MO 64504
Southside NeighborhoodEstimated Value: $78,000 - $141,000
Studio
--
Bath
1,526
Sq Ft
$73/Sq Ft
Est. Value
About This Home
This home is located at 5313 S 2nd St, Saint Joseph, MO 64504 and is currently estimated at $111,626, approximately $73 per square foot. 5313 S 2nd St is a home located in Buchanan County with nearby schools including Hyde Elementary School, Spring Garden Middle School, and Benton High School.
Ownership History
Date
Name
Owned For
Owner Type
Purchase Details
Closed on
Jul 1, 2024
Sold by
Belcher Lewis L and Belcher Deanna K
Bought by
Belcher Sierra D and Kirschner Dalton M
Current Estimated Value
Purchase Details
Closed on
Oct 27, 2011
Sold by
Branscum Virgil Lee and Branscum Ruy Faye
Bought by
Pike Deanna K and Beicher Lewis L
Purchase Details
Closed on
Apr 19, 2011
Sold by
Simpson Patricia Lynn and Fotovat Jennifer L
Bought by
Branscum Virgil Lee
Purchase Details
Closed on
Jan 12, 2011
Sold by
Simpson Patricia Lynn
Bought by
Branscum Virgil Lee
Purchase Details
Closed on
May 27, 2010
Sold by
Co La Casa Properties
Bought by
Simpson Patricia Lynn and Fotovat Jennifer Lynn
Purchase Details
Closed on
Apr 30, 2010
Sold by
Co Cit Loan Corp and Fk The Cit Group Consumer Finance
Bought by
Co La Casa Properties
Purchase Details
Closed on
Apr 16, 2009
Sold by
Obanion Twila T and Vanbelinde Margie J
Bought by
Be The Cit Group Consumer Finance Inc
Create a Home Valuation Report for This Property
The Home Valuation Report is an in-depth analysis detailing your home's value as well as a comparison with similar homes in the area
Home Values in the Area
Average Home Value in this Area
Purchase History
| Date | Buyer | Sale Price | Title Company |
|---|---|---|---|
| Belcher Sierra D | -- | None Listed On Document | |
| Pike Deanna K | -- | First American Title | |
| Branscum Virgil Lee | -- | None Available | |
| Branscum Virgil Lee | -- | None Available | |
| Simpson Patricia Lynn | -- | None Available | |
| Co La Casa Properties | -- | Missouri Title Associates | |
| Be The Cit Group Consumer Finance Inc | $20,690 | None Available |
Source: Public Records
Tax History
| Year | Tax Paid | Tax Assessment Tax Assessment Total Assessment is a certain percentage of the fair market value that is determined by local assessors to be the total taxable value of land and additions on the property. | Land | Improvement |
|---|---|---|---|---|
| 2025 | $261 | $3,590 | $2,120 | $1,470 |
| 2024 | $258 | $3,490 | $2,120 | $1,370 |
| 2023 | $258 | $3,490 | $2,120 | $1,370 |
| 2022 | $238 | $3,490 | $2,120 | $1,370 |
| 2021 | $239 | $3,490 | $2,120 | $1,370 |
| 2020 | $238 | $3,490 | $2,120 | $1,370 |
| 2019 | $230 | $3,490 | $2,120 | $1,370 |
| 2018 | $209 | $3,490 | $2,120 | $1,370 |
| 2017 | $207 | $3,490 | $0 | $0 |
| 2015 | $0 | $3,490 | $0 | $0 |
| 2014 | $226 | $3,490 | $0 | $0 |
Source: Public Records
Map
Nearby Homes
- 516 Blake St
- 5421 N Pointe (Lot 2b) Rd
- 522 E Colorado Ave
- 308 E Colorado Ave
- 302 E Colorado Ave
- 302 E Kansas Ave
- 621 E Colorado Ave
- 205 E Kansas Ave
- 209 W Nebraska Ave
- 315 Yale St
- 210 Illinois Ave
- 707 Court St
- 205 Michigan Ave
- 606 Harmon St
- 212 Ohio St
- 5002-5026 King Hill Ave
- 824 Garden St
- 718 Thompson Ave
- 118 Alabama St
- 805 Mason Ave
Your Personal Tour Guide
Ask me questions while you tour the home.