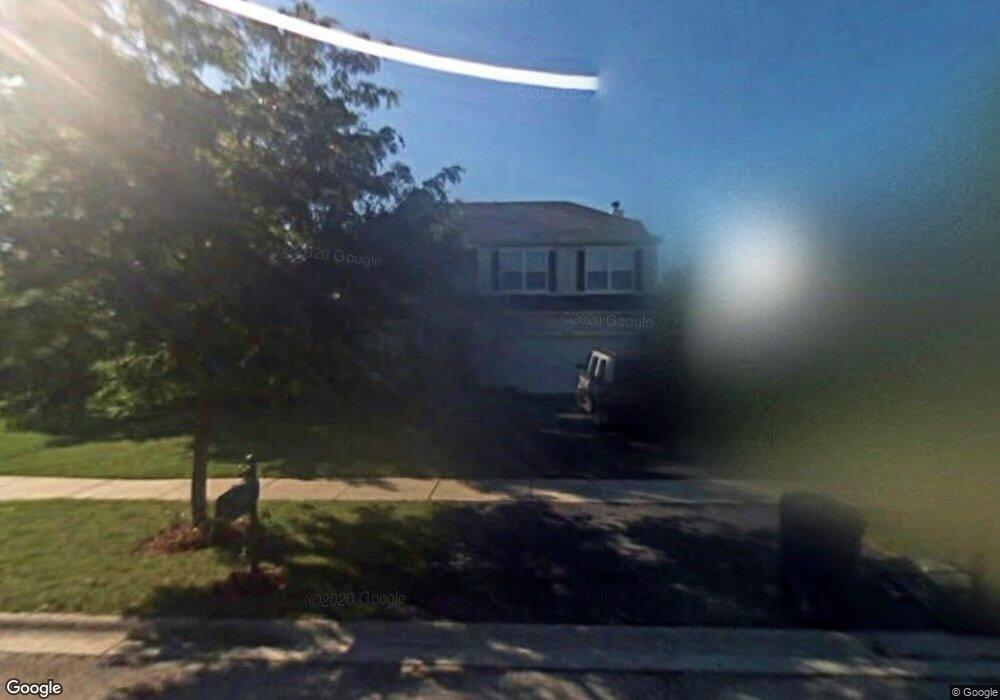
5314 Maple Glen Dr Plainfield, IL 60586
Fall Creek NeighborhoodEstimated Value: $393,175 - $451,000
Studio
1
Bath
2,639
Sq Ft
$164/Sq Ft
Est. Value
About This Home
This home is located at 5314 Maple Glen Dr, Plainfield, IL 60586 and is currently estimated at $432,044, approximately $163 per square foot. 5314 Maple Glen Dr is a home located in Will County with nearby schools including Wesmere Elementary School, Drauden Point Middle School, and Plainfield South High School.
Ownership History
Date
Name
Owned For
Owner Type
Purchase Details
Closed on
Dec 21, 2022
Sold by
Acosta Alfredo
Bought by
Acosta Lourdes
Current Estimated Value
Purchase Details
Closed on
Jun 27, 2019
Sold by
Acosta Lourdes
Bought by
Acosta Alfredo
Home Financials for this Owner
Home Financials are based on the most recent Mortgage that was taken out on this home.
Original Mortgage
$164,326
Interest Rate
4.75%
Mortgage Type
FHA
Purchase Details
Closed on
Aug 7, 2017
Sold by
Delong John and Delong Patty
Bought by
Acosta Lourdes
Purchase Details
Closed on
Jan 28, 1999
Sold by
Neumann Homes Inc
Bought by
Delong John and Delong Patty
Home Financials for this Owner
Home Financials are based on the most recent Mortgage that was taken out on this home.
Original Mortgage
$162,000
Interest Rate
6.81%
Create a Home Valuation Report for This Property
The Home Valuation Report is an in-depth analysis detailing your home's value as well as a comparison with similar homes in the area
Home Values in the Area
Average Home Value in this Area
Purchase History
| Date | Buyer | Sale Price | Title Company |
|---|---|---|---|
| Acosta Lourdes | -- | Chicago Title | |
| Acosta Alfredo | $190,000 | First American Title | |
| Acosta Lourdes | $210,000 | Attorney | |
| Delong John | $180,000 | Chicago Title Insurance Co |
Source: Public Records
Mortgage History
| Date | Status | Borrower | Loan Amount |
|---|---|---|---|
| Previous Owner | Acosta Alfredo | $164,326 | |
| Previous Owner | Delong John | $162,000 |
Source: Public Records
Tax History
| Year | Tax Paid | Tax Assessment Tax Assessment Total Assessment is a certain percentage of the fair market value that is determined by local assessors to be the total taxable value of land and additions on the property. | Land | Improvement |
|---|---|---|---|---|
| 2024 | $8,465 | $126,195 | $22,816 | $103,379 |
| 2023 | $8,465 | $113,977 | $20,607 | $93,370 |
| 2022 | $7,567 | $102,367 | $18,508 | $83,859 |
| 2021 | $7,177 | $95,670 | $17,297 | $78,373 |
| 2020 | $7,069 | $92,955 | $16,806 | $76,149 |
| 2019 | $6,824 | $88,570 | $16,013 | $72,557 |
| 2018 | $5,415 | $87,567 | $15,045 | $72,522 |
| 2017 | $7,218 | $83,215 | $14,297 | $68,918 |
| 2016 | $7,101 | $79,366 | $13,636 | $65,730 |
| 2015 | $6,130 | $74,348 | $12,774 | $61,574 |
| 2014 | $6,130 | $71,723 | $12,323 | $59,400 |
| 2013 | $6,130 | $71,723 | $12,323 | $59,400 |
Source: Public Records
Map
Nearby Homes
- 1905 Chestnut Grove Dr Unit 1
- 2004 Kingsbury Estates Dr
- 1910 Hampton Ct
- 1707 Chestnut Hill Rd
- 1700 Chestnut Hill Rd
- 1504 Lasser Dr
- 5108 Turnberry Ct
- 1409 Bridgehampton Dr
- 2010 Primrose Dr
- 2306 Willow Lakes Dr Unit 1
- 5116 New Haven Ct Unit 4
- 5214 Riviera Blvd
- 1909 Prairie Trail Ct
- 24447 Caton Farm Rd
- 5005 Inverness Cir
- 0 Theodore St
- 4757 Foster Ct Unit 3
- 5411 Maha Ct
- 1303 Bridgehampton Dr Unit 2
- 5210 Pine Trails Cir
- 5316 Maple Glen Dr
- 5313 Whispering Oaks Dr Unit 1A
- 5310 Maple Glen Dr
- 5318 Maple Glen Dr
- 5315 Whispering Oaks Dr Unit 1A
- 5311 Whispering Oaks Dr
- 5317 Whispering Oaks Dr Unit 1A
- 5309 Whispering Oaks Dr
- 5313 Maple Glen Dr
- 5308 Maple Glen Dr
- 5315 Maple Glen Dr
- 5311 Maple Glen Dr
- 5319 Whispering Oaks Dr
- 5402 Maple Glen Ct
- 5307 Whispering Oaks Dr
- 5400 Maple Glen Ct
- 5317 Maple Glen Dr
- 5309 Maple Glen Dr
- 5306 Maple Glen Dr
- 5321 Whispering Oaks Dr