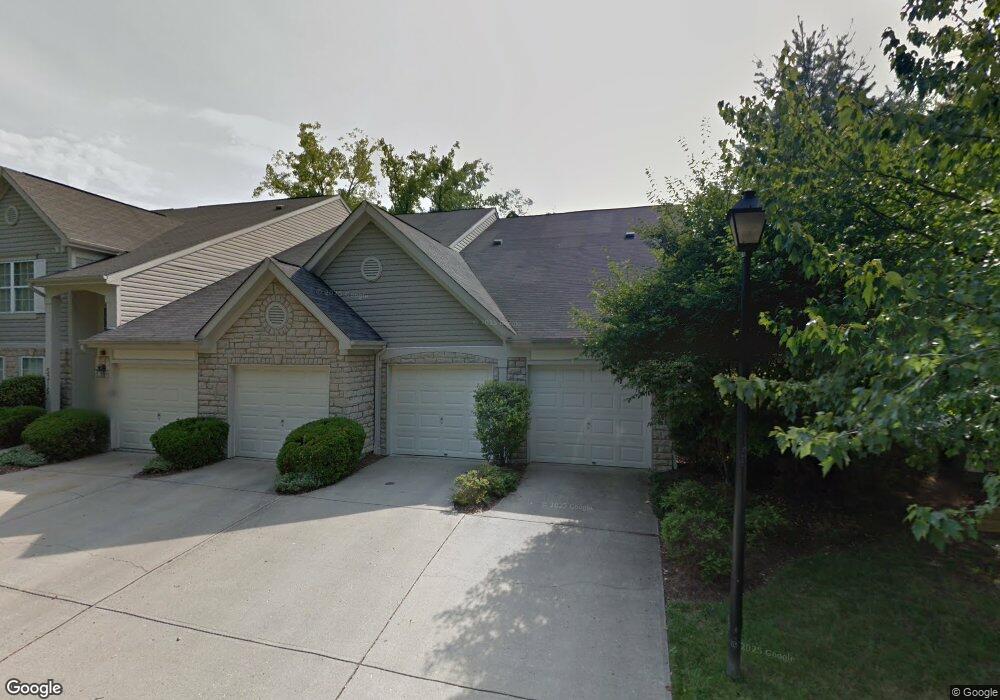
5315 Cooper Rd Unit J Cincinnati, OH 45242
Estimated Value: $244,609 - $290,000
2
Beds
2
Baths
1,274
Sq Ft
$214/Sq Ft
Est. Value
About This Home
This home is located at 5315 Cooper Rd Unit J, Cincinnati, OH 45242 and is currently estimated at $272,652, approximately $214 per square foot. 5315 Cooper Rd Unit J is a home located in Hamilton County with nearby schools including Edwin H Greene Intermediate Middle School, Sycamore Junior High School, and Sycamore High School.
Ownership History
Date
Name
Owned For
Owner Type
Purchase Details
Closed on
Sep 28, 2017
Sold by
Martis Dinesh J
Bought by
Jpj Cooper Creek Property Llc
Current Estimated Value
Purchase Details
Closed on
Nov 21, 2008
Sold by
Martis Juliana M
Bought by
Martis Dinesh J
Purchase Details
Closed on
Jul 9, 1999
Sold by
Soto Paulo C and Cowart Rebecca Cowart
Bought by
Hines William M
Home Financials for this Owner
Home Financials are based on the most recent Mortgage that was taken out on this home.
Original Mortgage
$105,000
Interest Rate
7.43%
Purchase Details
Closed on
Nov 13, 1995
Sold by
Drees Company
Bought by
Soto Paulo C and Soto Rebecca Cowart
Home Financials for this Owner
Home Financials are based on the most recent Mortgage that was taken out on this home.
Original Mortgage
$113,105
Interest Rate
7.42%
Create a Home Valuation Report for This Property
The Home Valuation Report is an in-depth analysis detailing your home's value as well as a comparison with similar homes in the area
Home Values in the Area
Average Home Value in this Area
Purchase History
| Date | Buyer | Sale Price | Title Company |
|---|---|---|---|
| Jpj Cooper Creek Property Llc | $145,000 | None Available | |
| Martis Dinesh J | -- | Attorney | |
| Hines William M | $133,500 | -- | |
| Soto Paulo C | -- | -- |
Source: Public Records
Mortgage History
| Date | Status | Borrower | Loan Amount |
|---|---|---|---|
| Previous Owner | Hines William M | $105,000 | |
| Previous Owner | Soto Paulo C | $113,105 |
Source: Public Records
Tax History Compared to Growth
Tax History
| Year | Tax Paid | Tax Assessment Tax Assessment Total Assessment is a certain percentage of the fair market value that is determined by local assessors to be the total taxable value of land and additions on the property. | Land | Improvement |
|---|---|---|---|---|
| 2024 | $3,779 | $72,051 | $8,750 | $63,301 |
| 2023 | $3,737 | $72,051 | $8,750 | $63,301 |
| 2022 | $3,541 | $57,061 | $8,750 | $48,311 |
| 2021 | $3,534 | $57,061 | $8,750 | $48,311 |
| 2020 | $3,489 | $57,061 | $8,750 | $48,311 |
| 2019 | $3,042 | $45,647 | $7,000 | $38,647 |
| 2018 | $2,934 | $45,647 | $7,000 | $38,647 |
| 2017 | $2,541 | $45,647 | $7,000 | $38,647 |
| 2016 | $2,652 | $45,500 | $8,750 | $36,750 |
| 2015 | $2,348 | $45,500 | $8,750 | $36,750 |
| 2014 | $2,352 | $45,500 | $8,750 | $36,750 |
| 2013 | $2,424 | $45,500 | $8,750 | $36,750 |
Source: Public Records
Map
Nearby Homes
- 9470 Wynnecrest Dr
- 9506 Park Manor Blvd
- 6250 Cooper Rd
- 4846 Myrtle Ave
- 9689 Cooper Ln
- 6399 Donjoy Dr
- 4736 Alpine Ave
- 4648 Belleview Ave
- 4642 Northfield Rd
- 9384 Lark Ct
- 4539 Leslie Ave
- 4612 Miller Rd
- 4582 Cooper Rd
- 5025 Aldine Dr
- 9001 Cherry St
- 4611 Belleview Ave
- 4500 Victor Ave
- 9216 Grandview Ave
- 9500 Todd Dr
- 7775 Hartfield Place
- 5315 Cooper Rd
- 5315 Cooper Rd
- 5305 Cooper Rd Unit 1B
- 5305 Cooper Rd Unit 1C
- 5305 Cooper Rd
- 5315 Cooper Rd
- 5315 Cooper Rd
- 5305 Cooper Rd
- 5315 Cooper Rd
- 5305 Cooper Rd Unit 1A
- 5315 Cooper Rd Unit K
- 5305 Cooper Rd Unit F
- 5305 Cooper Rd Unit B
- 5315 Cooper Rd Unit G
- 5305 Cooper Rd Unit A
- 5305 Cooper Rd Unit I
- 5315 Cooper Rd Unit H
- 5315 Cooper Rd Unit I
- 5305 Cooper Rd Unit E