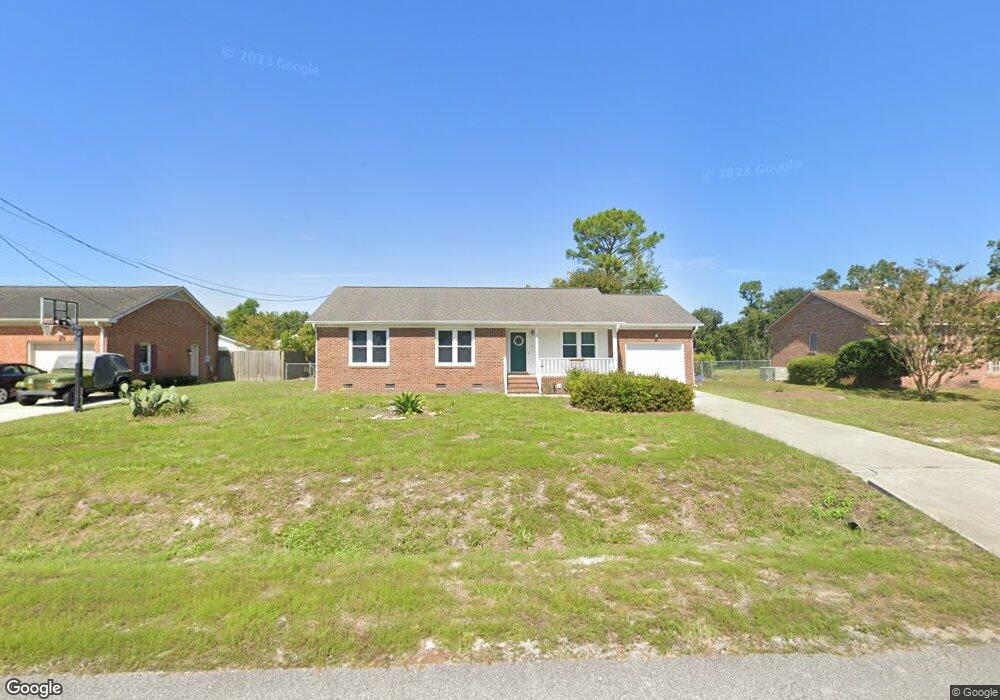
5315 Dandelion Dr Wilmington, NC 28405
Estimated Value: $317,713 - $343,000
3
Beds
2
Baths
1,269
Sq Ft
$263/Sq Ft
Est. Value
About This Home
This home is located at 5315 Dandelion Dr, Wilmington, NC 28405 and is currently estimated at $333,428, approximately $262 per square foot. 5315 Dandelion Dr is a home located in New Hanover County with nearby schools including John J. Blair Elementary School, Emma B. Trask Middle School, and New Hanover High School.
Ownership History
Date
Name
Owned For
Owner Type
Purchase Details
Closed on
Jul 28, 2005
Sold by
Ley Mollie Coldwell
Bought by
Watts Elizabeth Ann
Current Estimated Value
Home Financials for this Owner
Home Financials are based on the most recent Mortgage that was taken out on this home.
Original Mortgage
$127,900
Outstanding Balance
$66,463
Interest Rate
5.59%
Mortgage Type
Purchase Money Mortgage
Estimated Equity
$266,965
Purchase Details
Closed on
Nov 24, 1992
Sold by
Ley Frederick Robert
Bought by
Ley Mollie Coldwell
Purchase Details
Closed on
Jul 12, 1991
Sold by
Lintz Keith J Jodi C
Bought by
Ley Frederick Robert
Purchase Details
Closed on
Jul 1, 1987
Sold by
Lawing Richard M Ann B
Bought by
Lintz Keith J Jodi C
Purchase Details
Closed on
Jan 1, 1987
Sold by
Landmark Organization Inc
Bought by
Lawing Richard M Ann B
Purchase Details
Closed on
Feb 1, 1986
Bought by
Landmark Organization Inc
Create a Home Valuation Report for This Property
The Home Valuation Report is an in-depth analysis detailing your home's value as well as a comparison with similar homes in the area
Home Values in the Area
Average Home Value in this Area
Purchase History
| Date | Buyer | Sale Price | Title Company |
|---|---|---|---|
| Watts Elizabeth Ann | $160,000 | None Available | |
| Ley Mollie Coldwell | -- | -- | |
| Ley Frederick Robert | $9,000 | -- | |
| Lintz Keith J Jodi C | $69,500 | -- | |
| Lawing Richard M Ann B | $8,500 | -- | |
| Landmark Organization Inc | -- | -- |
Source: Public Records
Mortgage History
| Date | Status | Borrower | Loan Amount |
|---|---|---|---|
| Open | Watts Elizabeth Ann | $127,900 |
Source: Public Records
Tax History Compared to Growth
Tax History
| Year | Tax Paid | Tax Assessment Tax Assessment Total Assessment is a certain percentage of the fair market value that is determined by local assessors to be the total taxable value of land and additions on the property. | Land | Improvement |
|---|---|---|---|---|
| 2025 | $1,078 | $341,300 | $123,700 | $217,600 |
| 2023 | $1,078 | $192,200 | $69,400 | $122,800 |
| 2022 | $1,082 | $192,200 | $69,400 | $122,800 |
| 2021 | $1,064 | $192,200 | $69,400 | $122,800 |
| 2020 | $933 | $147,500 | $41,400 | $106,100 |
| 2019 | $933 | $147,500 | $41,400 | $106,100 |
| 2018 | $933 | $147,500 | $41,400 | $106,100 |
| 2017 | $955 | $147,500 | $41,400 | $106,100 |
| 2016 | $945 | $136,400 | $41,400 | $95,000 |
| 2015 | $878 | $136,400 | $41,400 | $95,000 |
| 2014 | $863 | $136,400 | $41,400 | $95,000 |
Source: Public Records
Map
Nearby Homes
- 5325 Lord Tennyson Rd
- 733 Bracken Fern Dr
- 1009 Fitzgerald Dr
- 606 Fitzgerald Dr
- 102 Albemarle Rd
- 5202 Fitzgerald Dr
- 508 N Green Meadows Dr
- 601 High Bush Ct
- 4922 Shelley Dr
- 1314 Carlyle Ln
- 511 Albemarle Ct
- 518 Albemarle Ct
- 5932 Chester St
- 722 N College Rd
- 5912 Chester St
- 4731 Ballast Dr
- 110 Edwards St
- 211 Birdie Ln
- 6110 Gordon Rd
- 635 N College Rd
- 5317 Dandelion Dr
- 5319 Dandelion Dr
- 5311 Dandelion Dr
- 5314 Lord Tennyson Dr
- 5310 Lord Tennyson Dr
- 5318 Lord Tennyson Dr
- 5314 Dandelion Dr
- 5312 Dandelion Dr
- 5316 Dandelion Dr
- 5306 Lord Tennyson Dr
- 5321 Dandelion Dr
- 5309 Dandelion Dr
- 5322 Lord Tennyson Dr
- 5310 Dandelion Dr
- 5318 Dandelion Dr
- 5308 Dandelion Dr
- 5302 Lord Tennyson Dr
- 5326 Lord Tennyson Dr
- 5323 Dandelion Dr
- 5320 Dandelion Dr