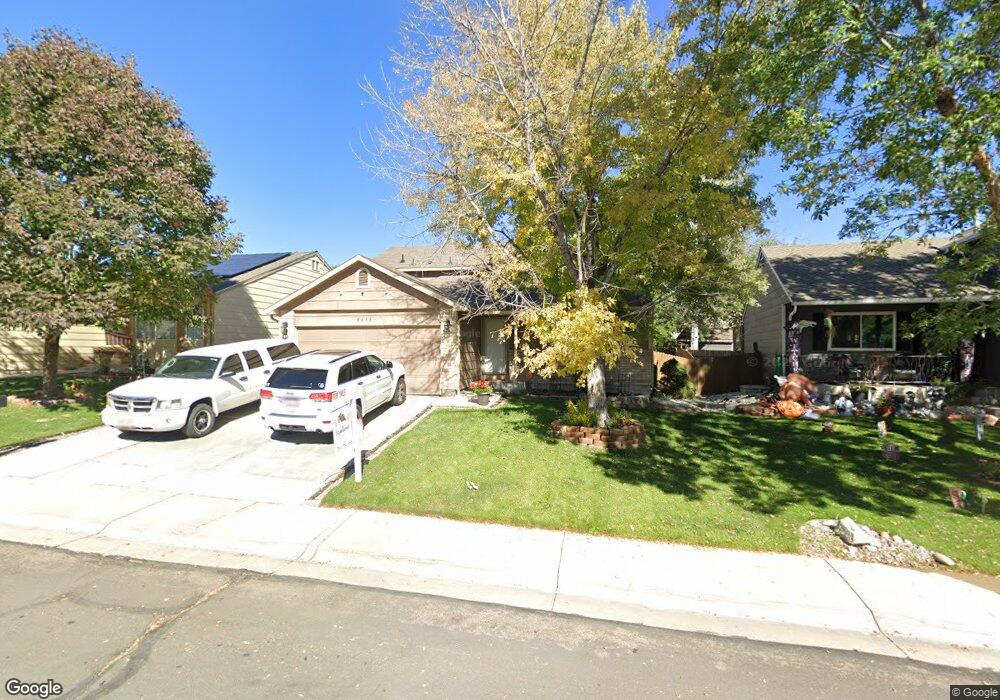
5315 E 129th Ave Thornton, CO 80241
Estimated Value: $497,429 - $523,000
3
Beds
2
Baths
1,568
Sq Ft
$329/Sq Ft
Est. Value
About This Home
This home is located at 5315 E 129th Ave, Thornton, CO 80241 and is currently estimated at $516,107, approximately $329 per square foot. 5315 E 129th Ave is a home located in Adams County with nearby schools including Eagleview Elementary School, Rocky Top Middle School, and Horizon High School.
Ownership History
Date
Name
Owned For
Owner Type
Purchase Details
Closed on
Jul 6, 2018
Sold by
Brown Timothy Lee
Bought by
Canfield Nicholas David and Canfield Kristin R
Current Estimated Value
Home Financials for this Owner
Home Financials are based on the most recent Mortgage that was taken out on this home.
Original Mortgage
$385,105
Outstanding Balance
$334,489
Interest Rate
4.6%
Mortgage Type
VA
Estimated Equity
$181,618
Purchase Details
Closed on
Apr 24, 2002
Sold by
Drews Jeffrey A
Bought by
Brown Timothy Lee
Home Financials for this Owner
Home Financials are based on the most recent Mortgage that was taken out on this home.
Original Mortgage
$210,398
Interest Rate
7.09%
Mortgage Type
FHA
Purchase Details
Closed on
Dec 4, 1997
Sold by
Melody Homes Inc
Bought by
Drews Jeffrey A
Home Financials for this Owner
Home Financials are based on the most recent Mortgage that was taken out on this home.
Original Mortgage
$96,250
Interest Rate
7.3%
Create a Home Valuation Report for This Property
The Home Valuation Report is an in-depth analysis detailing your home's value as well as a comparison with similar homes in the area
Home Values in the Area
Average Home Value in this Area
Purchase History
| Date | Buyer | Sale Price | Title Company |
|---|---|---|---|
| Canfield Nicholas David | $377,000 | Land Title Guarantee Co | |
| Brown Timothy Lee | $213,700 | Land Title Guarantee Company | |
| Drews Jeffrey A | $120,346 | Land Title |
Source: Public Records
Mortgage History
| Date | Status | Borrower | Loan Amount |
|---|---|---|---|
| Open | Canfield Nicholas David | $385,105 | |
| Previous Owner | Brown Timothy Lee | $210,398 | |
| Previous Owner | Drews Jeffrey A | $96,250 |
Source: Public Records
Tax History Compared to Growth
Tax History
| Year | Tax Paid | Tax Assessment Tax Assessment Total Assessment is a certain percentage of the fair market value that is determined by local assessors to be the total taxable value of land and additions on the property. | Land | Improvement |
|---|---|---|---|---|
| 2024 | $3,397 | $32,380 | $6,250 | $26,130 |
| 2023 | $3,362 | $36,530 | $6,160 | $30,370 |
| 2022 | $2,905 | $26,370 | $6,320 | $20,050 |
| 2021 | $3,003 | $26,370 | $6,320 | $20,050 |
| 2020 | $2,604 | $23,340 | $6,510 | $16,830 |
| 2019 | $2,609 | $23,340 | $6,510 | $16,830 |
| 2018 | $2,263 | $19,670 | $6,840 | $12,830 |
| 2017 | $2,058 | $19,670 | $6,840 | $12,830 |
| 2016 | $1,870 | $17,400 | $3,820 | $13,580 |
| 2015 | $1,867 | $17,400 | $3,820 | $13,580 |
| 2014 | -- | $14,260 | $2,950 | $11,310 |
Source: Public Records
Map
Nearby Homes
- 5341 E 129th Way
- 13028 Grape Ct
- 12780 Elm St
- 5581 Hudson Cir
- 13243 Holly St Unit F
- 5628 Hudson Cir
- 12943 Dexter Way
- 5575 E 130th Dr
- 13271 Holly St Unit B
- 12698 Fairfax St
- 12694 Fairfax St
- 13275 Holly St Unit F
- 12865 Clermont St
- 15372 Jersey Ct
- 12797 Ivy St
- 13022 Bellaire St
- 12770 Ivanhoe St
- 12741 Ivanhoe St
- 12792 Ivy St
- 12579 Forest Dr
- 5305 E 129th Ave
- 5325 E 129th Ave
- 5284 E 129th Way
- 5295 E 129th Ave
- 5335 E 129th Ave
- 5290 E 129th Way
- 5280 E 129th Way
- 5328 E 129th Ave
- 5345 E 129th Ave
- 5318 E 129th Ave
- 5285 E 129th Ave
- 5338 E 129th Ave
- 5310 E 129th Way
- 5274 E 129th Way
- 5308 E 129th Ave
- 5348 E 129th Ave
- 5320 E 129th Way
- 5275 E 129th Ave
- 5270 E 129th Way
- 5298 E 129th Ave