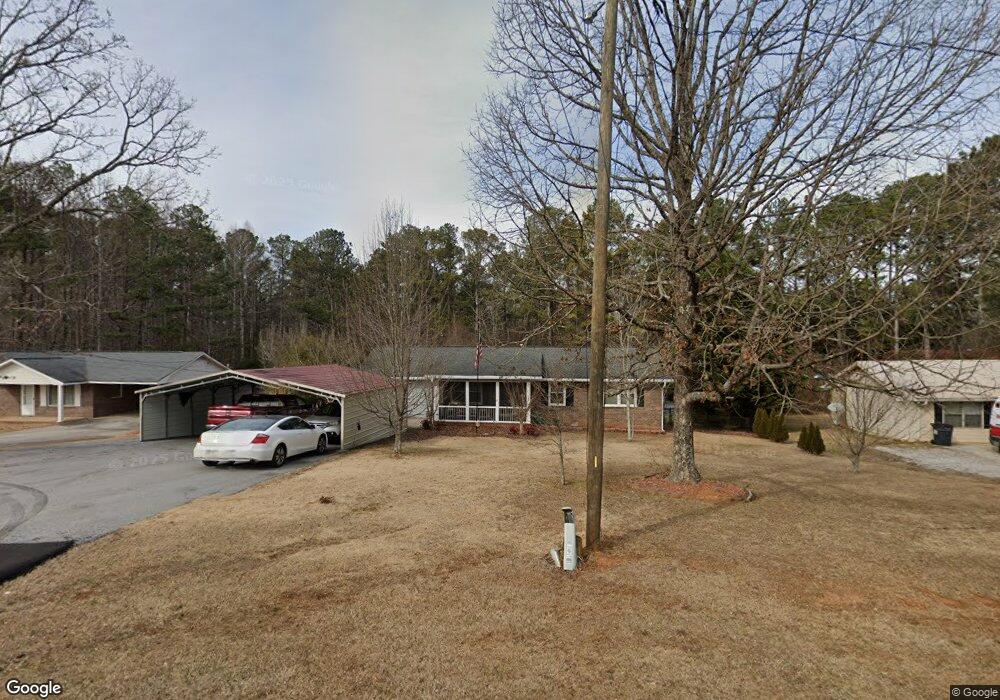
5315 Mulberry Rock Rd Villa Rica, GA 30180
Estimated Value: $262,000 - $319,000
3
Beds
1
Bath
1,450
Sq Ft
$206/Sq Ft
Est. Value
About This Home
This home is located at 5315 Mulberry Rock Rd, Villa Rica, GA 30180 and is currently estimated at $299,171, approximately $206 per square foot. 5315 Mulberry Rock Rd is a home located in Paulding County with nearby schools including New Georgia Elementary School, Carl Scoggins Sr. Middle School, and South Paulding High School.
Ownership History
Date
Name
Owned For
Owner Type
Purchase Details
Closed on
Jun 12, 2024
Sold by
Johns Deborah Tr
Bought by
Lennox Christopher Ray and Sellers Marie Bennett
Current Estimated Value
Purchase Details
Closed on
Jan 4, 2014
Sold by
Queen Diane
Bought by
Strickland Larry and Strickland Martin Diane
Home Financials for this Owner
Home Financials are based on the most recent Mortgage that was taken out on this home.
Original Mortgage
$99,949
Interest Rate
4.43%
Mortgage Type
New Conventional
Purchase Details
Closed on
Jan 31, 2007
Sold by
Ballew Tony E
Bought by
Queen Diane
Home Financials for this Owner
Home Financials are based on the most recent Mortgage that was taken out on this home.
Original Mortgage
$105,000
Interest Rate
6.07%
Mortgage Type
New Conventional
Purchase Details
Closed on
Nov 1, 2005
Sold by
Dunlap Darrell A
Bought by
Bellew Tony E
Create a Home Valuation Report for This Property
The Home Valuation Report is an in-depth analysis detailing your home's value as well as a comparison with similar homes in the area
Home Values in the Area
Average Home Value in this Area
Purchase History
| Date | Buyer | Sale Price | Title Company |
|---|---|---|---|
| Lennox Christopher Ray | $315,000 | -- | |
| Strickland Larry | -- | -- | |
| Queen Diane | $105,000 | -- | |
| Bellew Tony E | $69,901 | -- |
Source: Public Records
Mortgage History
| Date | Status | Borrower | Loan Amount |
|---|---|---|---|
| Previous Owner | Strickland Larry | $99,949 | |
| Previous Owner | Queen Diane | $105,000 |
Source: Public Records
Tax History Compared to Growth
Tax History
| Year | Tax Paid | Tax Assessment Tax Assessment Total Assessment is a certain percentage of the fair market value that is determined by local assessors to be the total taxable value of land and additions on the property. | Land | Improvement |
|---|---|---|---|---|
| 2024 | $584 | $89,604 | $4,760 | $84,844 |
| 2023 | $668 | $86,276 | $4,560 | $81,716 |
| 2022 | $1,175 | $75,416 | $4,480 | $70,936 |
| 2021 | $1,039 | $59,628 | $3,200 | $56,428 |
| 2020 | $1,027 | $57,272 | $2,760 | $54,512 |
| 2019 | $922 | $51,128 | $2,360 | $48,768 |
| 2018 | $720 | $41,544 | $6,760 | $34,784 |
| 2017 | $1,197 | $41,036 | $6,760 | $34,276 |
| 2016 | $981 | $34,292 | $7,200 | $27,092 |
| 2015 | $935 | $32,220 | $7,000 | $25,220 |
| 2014 | $823 | $27,940 | $5,960 | $21,980 |
| 2013 | -- | $23,760 | $6,200 | $17,560 |
Source: Public Records
Map
Nearby Homes
- 5333 Mulberry Rock Rd
- 5303 Mulberry Rock Rd
- 5355 Mulberry Rock Rd
- 83 Doke Cohran Rd
- 103 Doke Cohran Rd
- 33 Doke Cohran Rd
- 33 Doke Cohran Rd
- 5245 Mulberry Rock Rd
- 119 Doke Cohran Rd
- 2 Doke Cohran Rd
- 1 Doke Cohran Rd
- 5348 Mulberry Rock Rd
- 84 Doke Cohran Rd
- 5240 Mulberry Rock Rd
- 42 Whispering Pines Dr
- 20 Whispering Way
- 5413 Mulberry Rock Rd
- 151 Doke Cohran Rd
- 5220 Mulberry Rock Rd
- 5300 Mulberry Rock Rd