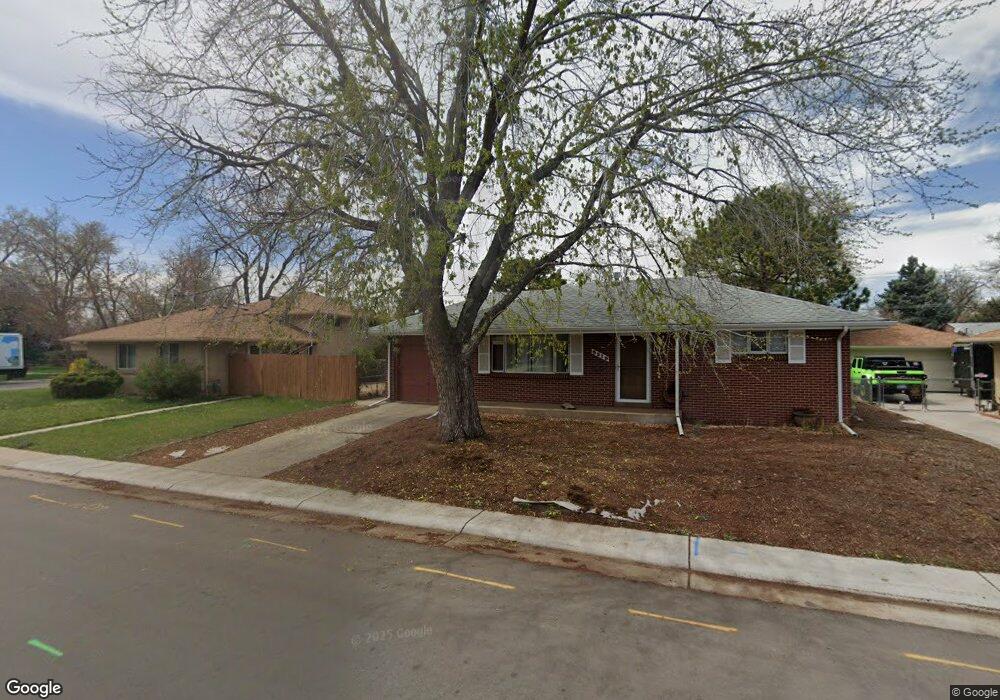
5315 Otis St Arvada, CO 80002
Estimated Value: $461,000 - $504,351
2
Beds
2
Baths
894
Sq Ft
$546/Sq Ft
Est. Value
About This Home
This home is located at 5315 Otis St, Arvada, CO 80002 and is currently estimated at $488,088, approximately $545 per square foot. 5315 Otis St is a home located in Jefferson County with nearby schools including Secrest Elementary School, North Arvada Middle School, and Arvada High School.
Ownership History
Date
Name
Owned For
Owner Type
Purchase Details
Closed on
Nov 29, 2016
Sold by
Steele Greg
Bought by
Mcgowan Christopher
Current Estimated Value
Home Financials for this Owner
Home Financials are based on the most recent Mortgage that was taken out on this home.
Original Mortgage
$240,000
Outstanding Balance
$115,515
Interest Rate
3.52%
Mortgage Type
New Conventional
Estimated Equity
$372,573
Purchase Details
Closed on
Jun 30, 2016
Sold by
Rucker Mariann and Rucker Marianne
Bought by
Steele Greg
Home Financials for this Owner
Home Financials are based on the most recent Mortgage that was taken out on this home.
Original Mortgage
$100,000
Interest Rate
5%
Mortgage Type
Purchase Money Mortgage
Purchase Details
Closed on
Mar 21, 1994
Sold by
Travis Helen L and Rucker Marianne
Bought by
Rucker Marianne
Home Financials for this Owner
Home Financials are based on the most recent Mortgage that was taken out on this home.
Original Mortgage
$15,173
Interest Rate
7.49%
Mortgage Type
Construction
Create a Home Valuation Report for This Property
The Home Valuation Report is an in-depth analysis detailing your home's value as well as a comparison with similar homes in the area
Home Values in the Area
Average Home Value in this Area
Purchase History
| Date | Buyer | Sale Price | Title Company |
|---|---|---|---|
| Mcgowan Christopher | $300,000 | Chicago Title Co | |
| Steele Greg | $223,000 | Chicago Title | |
| Rucker Marianne | -- | -- |
Source: Public Records
Mortgage History
| Date | Status | Borrower | Loan Amount |
|---|---|---|---|
| Open | Mcgowan Christopher | $240,000 | |
| Previous Owner | Steele Greg | $100,000 | |
| Previous Owner | Rucker Marianne | $15,173 |
Source: Public Records
Tax History Compared to Growth
Tax History
| Year | Tax Paid | Tax Assessment Tax Assessment Total Assessment is a certain percentage of the fair market value that is determined by local assessors to be the total taxable value of land and additions on the property. | Land | Improvement |
|---|---|---|---|---|
| 2024 | $2,841 | $28,515 | $13,424 | $15,091 |
| 2023 | $2,841 | $28,515 | $13,424 | $15,091 |
| 2022 | $2,425 | $24,183 | $9,933 | $14,250 |
| 2021 | $2,461 | $24,879 | $10,219 | $14,660 |
| 2020 | $2,222 | $22,492 | $8,844 | $13,648 |
| 2019 | $2,192 | $22,492 | $8,844 | $13,648 |
| 2018 | $1,820 | $18,138 | $5,903 | $12,235 |
| 2017 | $1,668 | $18,138 | $5,903 | $12,235 |
| 2016 | $1,390 | $14,215 | $5,276 | $8,939 |
| 2015 | $1,167 | $14,215 | $5,276 | $8,939 |
| 2014 | $1,167 | $11,216 | $4,872 | $6,344 |
Source: Public Records
Map
Nearby Homes
- 6801 W 52nd Ave
- 6933 W 52nd Place
- 6700 W 55th Ave
- 5465 Reed Ct
- 5525 Pierce Ct
- 6247 W 53rd Ave
- 5513 Newland Way
- 6890 W 55th Place
- 5465 Saulsbury Ct
- 5495 Saulsbury Ct
- 6855 Reno Dr
- 7011 Grandview Ave
- 6105 W 49th Place
- 6902 Ralston Rd
- 4963 Harlan St
- 6920 W 48th Ave Unit 6920
- 4755 Reed St
- 5815 Pierce St Unit A-H
- 4880 Ingalls St
- 4730 Pierce St