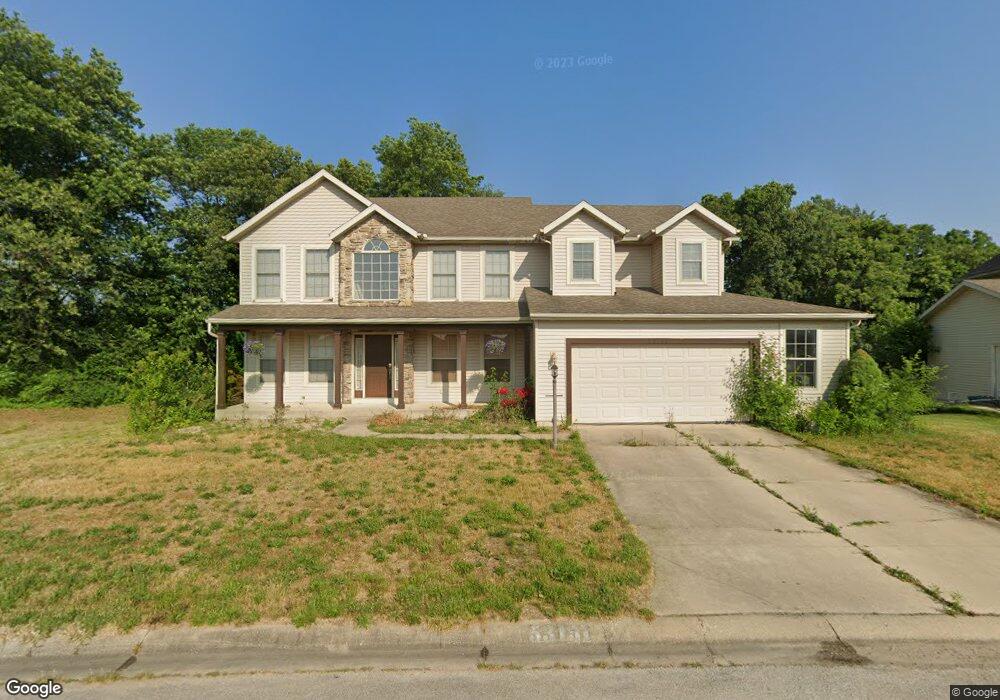
53151 Meadowgrass Ln South Bend, IN 46628
Estimated Value: $373,000 - $492,689
4
Beds
4
Baths
4,950
Sq Ft
$88/Sq Ft
Est. Value
About This Home
This home is located at 53151 Meadowgrass Ln, South Bend, IN 46628 and is currently estimated at $435,922, approximately $88 per square foot. 53151 Meadowgrass Ln is a home located in St. Joseph County with nearby schools including Warren Elementary School, Clay Intermediate Center, and Dickinson Fine Arts Academy.
Ownership History
Date
Name
Owned For
Owner Type
Purchase Details
Closed on
Sep 14, 2009
Sold by
Federal Home Loan Mortgage Corporation
Bought by
Henning David L and Swanson Laura J
Current Estimated Value
Home Financials for this Owner
Home Financials are based on the most recent Mortgage that was taken out on this home.
Original Mortgage
$249,104
Interest Rate
5.19%
Mortgage Type
Purchase Money Mortgage
Purchase Details
Closed on
Jun 18, 2009
Sold by
Bush Terrance O and Bush Michele J
Bought by
Federal Home Loan Mortgage Corporation
Purchase Details
Closed on
Sep 25, 2006
Sold by
Cleland Builders Incorporated
Bought by
Bush Terrance O and Bush Michele J
Home Financials for this Owner
Home Financials are based on the most recent Mortgage that was taken out on this home.
Original Mortgage
$335,000
Interest Rate
6.58%
Mortgage Type
Purchase Money Mortgage
Purchase Details
Closed on
May 11, 2006
Sold by
Natures Gate Llc
Bought by
Cleland Builders Incorporated
Create a Home Valuation Report for This Property
The Home Valuation Report is an in-depth analysis detailing your home's value as well as a comparison with similar homes in the area
Home Values in the Area
Average Home Value in this Area
Purchase History
| Date | Buyer | Sale Price | Title Company |
|---|---|---|---|
| Henning David L | -- | Statewide Title | |
| Federal Home Loan Mortgage Corporation | $300,000 | None Available | |
| Bush Terrance O | -- | Metropolitan Title In Llc | |
| Cleland Builders Incorporated | -- | None Available |
Source: Public Records
Mortgage History
| Date | Status | Borrower | Loan Amount |
|---|---|---|---|
| Closed | Henning David L | $249,104 | |
| Previous Owner | Bush Terrance O | $335,000 |
Source: Public Records
Tax History Compared to Growth
Tax History
| Year | Tax Paid | Tax Assessment Tax Assessment Total Assessment is a certain percentage of the fair market value that is determined by local assessors to be the total taxable value of land and additions on the property. | Land | Improvement |
|---|---|---|---|---|
| 2024 | $5,909 | $503,300 | $44,500 | $458,800 |
| 2023 | $5,856 | $484,900 | $63,700 | $421,200 |
| 2022 | $5,205 | $423,400 | $39,500 | $383,900 |
| 2021 | $4,754 | $383,300 | $31,000 | $352,300 |
| 2020 | $4,398 | $355,100 | $28,400 | $326,700 |
| 2019 | $3,615 | $356,200 | $28,200 | $328,000 |
| 2018 | $3,768 | $318,700 | $24,800 | $293,900 |
| 2017 | $3,345 | $276,200 | $24,800 | $251,400 |
| 2016 | $3,436 | $279,000 | $24,800 | $254,200 |
| 2014 | $3,038 | $246,600 | $21,500 | $225,100 |
Source: Public Records
Map
Nearby Homes
- 25860 Running Creek Dr
- 53140 Flowing Stream Ct
- 53128 Flowing Stream Ct
- 53182 Grassy Knoll Dr
- 53170 Grassy Knoll Dr
- 25684 Rolling Hills Dr
- 25655 Rolling Hills Dr
- 52931 Primrose Rd
- 53130 Turning Leaf Dr
- 52744 Blue Winged Trail
- The Gipper Plan at Augustine Lake Estates
- The Sorin Plan at Augustine Lake Estates
- The Rockne Plan at Augustine Lake Estates
- The Leahy Plan at Augustine Lake Estates
- The Badin Plan at Augustine Lake Estates
- The Kelley Plan at Augustine Lake Estates
- 52699 Common Eider Trail
- 52700 Blue Winged Trail
- 52693 Blue Winged Trail
- 25855 Fox Tail Trail
- 25975 Meadowgrass Ln
- 53167 Meadowgrass Ln
- 25952 Rolling Hills Dr
- 53196 Meadowgrass Ln
- 25959 Rolling Hills Dr
- 53181 Meadowgrass Ln
- 0 Meadow Grass Ln (Lot 156) Unit 511912
- 25938 Rolling Hills Dr
- 25943 Rolling Hills Dr
- 53182 Meadow Grass Ln
- 53167 Gentle Breeze Ct
- 53195 Meadowgrass Ln
- 25922 Rolling Hills Dr
- 25927 Rolling Hills Dr
- 25951 Running Creek Dr
- 53181 Gentle Breeze Ct
- 53160 Gentle Breeze Ct
- 0 Running Creek Dr (Lot 145) Unit 512049
- 0 Running Creek Dr (Lot 41) Unit 511910
- 25910 Rolling Hills Dr Unit ID1257051P