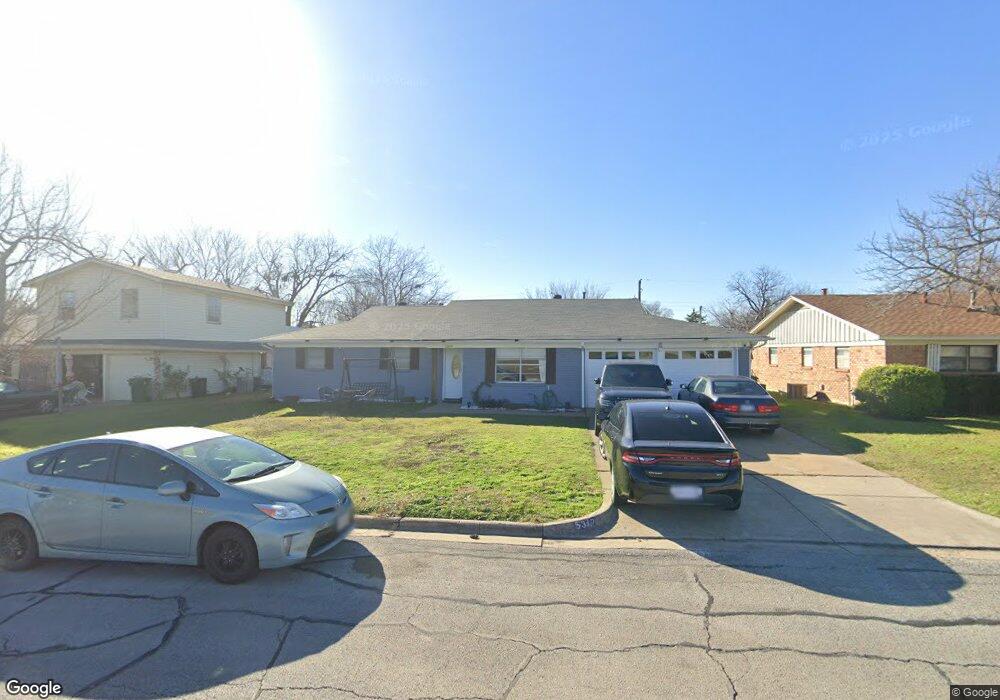
5317 Greenwood Way North Richland Hills, TX 76180
Estimated Value: $287,000 - $325,000
3
Beds
2
Baths
1,635
Sq Ft
$184/Sq Ft
Est. Value
About This Home
This home is located at 5317 Greenwood Way, North Richland Hills, TX 76180 and is currently estimated at $301,218, approximately $184 per square foot. 5317 Greenwood Way is a home located in Tarrant County with nearby schools including Holiday Heights Elementary School, North Richland Middle School, and Richland High School.
Ownership History
Date
Name
Owned For
Owner Type
Purchase Details
Closed on
Dec 30, 2024
Sold by
Alam Hiba and Faisal Qaed
Bought by
Mohammed Abdullah
Current Estimated Value
Home Financials for this Owner
Home Financials are based on the most recent Mortgage that was taken out on this home.
Original Mortgage
$300,000
Outstanding Balance
$297,905
Interest Rate
6.78%
Mortgage Type
New Conventional
Estimated Equity
$3,313
Purchase Details
Closed on
Nov 27, 2018
Sold by
Smith Vesta Alliene and Smith Alliene
Bought by
Hiba Alma
Home Financials for this Owner
Home Financials are based on the most recent Mortgage that was taken out on this home.
Original Mortgage
$70,000
Interest Rate
4.8%
Mortgage Type
New Conventional
Create a Home Valuation Report for This Property
The Home Valuation Report is an in-depth analysis detailing your home's value as well as a comparison with similar homes in the area
Home Values in the Area
Average Home Value in this Area
Purchase History
| Date | Buyer | Sale Price | Title Company |
|---|---|---|---|
| Mohammed Abdullah | -- | Trinity Title | |
| Hiba Alma | -- | Texas Secure Title Co |
Source: Public Records
Mortgage History
| Date | Status | Borrower | Loan Amount |
|---|---|---|---|
| Open | Mohammed Abdullah | $300,000 | |
| Previous Owner | Hiba Alma | $70,000 |
Source: Public Records
Tax History Compared to Growth
Tax History
| Year | Tax Paid | Tax Assessment Tax Assessment Total Assessment is a certain percentage of the fair market value that is determined by local assessors to be the total taxable value of land and additions on the property. | Land | Improvement |
|---|---|---|---|---|
| 2025 | $3,791 | $250,000 | $50,000 | $200,000 |
| 2024 | $3,791 | $250,000 | $50,000 | $200,000 |
| 2023 | $5,078 | $256,949 | $50,000 | $206,949 |
| 2022 | $5,064 | $237,775 | $35,000 | $202,775 |
| 2021 | $4,868 | $207,915 | $35,000 | $172,915 |
| 2020 | $4,425 | $173,909 | $35,000 | $138,909 |
| 2019 | $4,614 | $175,219 | $35,000 | $140,219 |
| 2018 | $1,071 | $125,780 | $35,000 | $90,780 |
| 2017 | $3,076 | $149,799 | $35,000 | $114,799 |
| 2016 | $2,797 | $131,313 | $20,000 | $111,313 |
| 2015 | $1,135 | $94,500 | $16,000 | $78,500 |
| 2014 | $1,135 | $94,500 | $16,000 | $78,500 |
Source: Public Records
Map
Nearby Homes
- 5336 Davis Blvd
- 5320 Topper Dr
- 7717 Janetta Dr
- 7529 Susan Ct
- 7521 Susan Ct
- 5108 Nancy Ln
- 7821 Davis Blvd
- 7501 Lola Dr
- 5117 Maryanna Way
- 7409 Jade Cir
- 5024 Maryanna Way
- 4916 Susan Lee Ln
- 5113 Bob Dr
- 5813 Steeplewood Dr
- 5016 Winder Ct
- 5304 Colorado Blvd
- 7549 Terry Dr
- 7616 David Ct
- 8417 Emerald Cir
- 8020 Laura St
- 5321 Greenwood Way
- 5313 Greenwood Way
- 5312 Roberta Dr
- 5316 Roberta Dr
- 5401 Greenwood Way
- 5309 Greenwood Way
- 5308 Roberta Dr
- 5320 Roberta Dr
- 5405 Greenwood Way
- 5305 Greenwood Way
- 5304 Roberta Dr
- 5324 Roberta Dr
- 5400 Greenwood Way
- 5409 Greenwood Way
- 5301 Greenwood Way
- 5317 Roberta Dr
- 5300 Roberta Dr
- 5309 Roberta Dr
- 5328 Roberta Dr
- 5321 Roberta Dr