K
Seller's Agent in 2022
Kadie Stidham
Orchard Brokerage, LLC
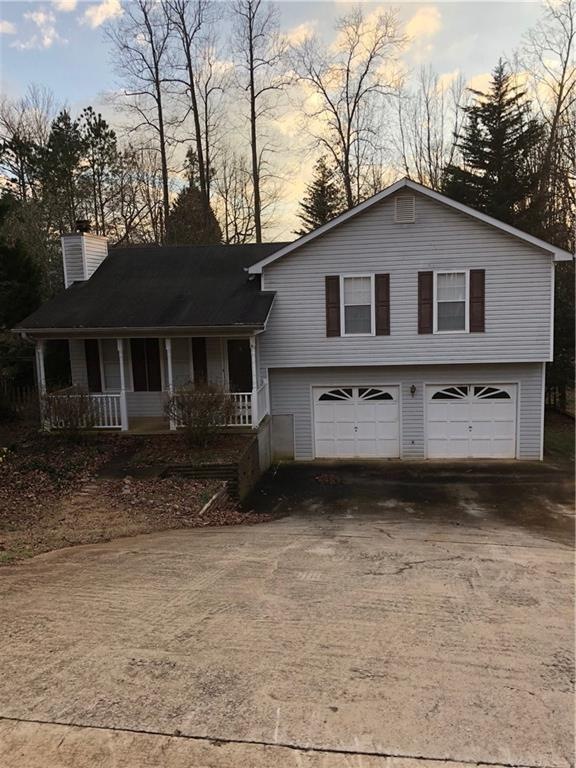
Investors: possible Rental or Renovate and sell. Split Level- good size backyard. Great Schools. Cash Offers Only. Call today for viewing.
Last Agent to Sell the Property
Keller Williams Realty Atlanta Partners License #205275 Listed on: 02/21/2018

| Date | Type | Sale Price | Title Company |
|---|---|---|---|
| Warranty Deed | $295,000 | -- | |
| Warranty Deed | $299,900 | -- | |
| Deed | $290,187 | -- | |
| Warranty Deed | $117,500 | -- | |
| Deed | -- | -- | |
| Quit Claim Deed | -- | -- | |
| Deed | $109,900 | -- | |
| Deed | $88,900 | -- | |
| Deed | $17,500 | -- |
| Date | Status | Loan Amount | Loan Type |
|---|---|---|---|
| Open | $286,150 | New Conventional | |
| Previous Owner | $184,320 | No Value Available | |
| Previous Owner | -- | No Value Available | |
| Previous Owner | $132,000 | New Conventional | |
| Previous Owner | $113,300 | FHA | |
| Previous Owner | $109,800 | FHA | |
| Previous Owner | $84,450 | New Conventional |
| Date | Event | Price | Change | Sq Ft Price |
|---|---|---|---|---|
| 12/22/2022 12/22/22 | Sold | $295,000 | -2.6% | $259 / Sq Ft |
| 11/30/2022 11/30/22 | Pending | -- | -- | -- |
| 11/10/2022 11/10/22 | Price Changed | $303,000 | -0.7% | $266 / Sq Ft |
| 10/06/2022 10/06/22 | Price Changed | $305,000 | -1.6% | $268 / Sq Ft |
| 09/15/2022 09/15/22 | Price Changed | $310,000 | -4.3% | $272 / Sq Ft |
| 09/01/2022 09/01/22 | Price Changed | $324,000 | -1.8% | $284 / Sq Ft |
| 08/04/2022 08/04/22 | Price Changed | $330,000 | -3.8% | $289 / Sq Ft |
| 07/25/2022 07/25/22 | For Sale | $343,000 | +90.6% | $301 / Sq Ft |
| 07/20/2018 07/20/18 | Sold | $180,000 | 0.0% | $158 / Sq Ft |
| 06/17/2018 06/17/18 | Pending | -- | -- | -- |
| 05/31/2018 05/31/18 | For Sale | $180,000 | 0.0% | $158 / Sq Ft |
| 05/21/2018 05/21/18 | Pending | -- | -- | -- |
| 05/17/2018 05/17/18 | For Sale | $180,000 | +53.2% | $158 / Sq Ft |
| 03/12/2018 03/12/18 | Sold | $117,500 | -9.5% | $103 / Sq Ft |
| 02/27/2018 02/27/18 | Pending | -- | -- | -- |
| 02/21/2018 02/21/18 | For Sale | $129,900 | -- | $114 / Sq Ft |
| Year | Tax Paid | Tax Assessment Tax Assessment Total Assessment is a certain percentage of the fair market value that is determined by local assessors to be the total taxable value of land and additions on the property. | Land | Improvement |
|---|---|---|---|---|
| 2024 | $3,126 | $121,760 | $15,600 | $106,160 |
| 2023 | $3,081 | $119,800 | $15,600 | $104,200 |
| 2022 | $2,559 | $96,600 | $10,680 | $85,920 |
| 2021 | $1,979 | $72,720 | $7,760 | $64,960 |
| 2020 | $1,854 | $66,120 | $7,760 | $58,360 |
| 2019 | $2,030 | $72,080 | $8,480 | $63,600 |
| 2018 | $1,289 | $41,400 | $7,760 | $33,640 |
| 2017 | $1,107 | $37,360 | $7,760 | $29,600 |
| 2016 | $1,081 | $37,320 | $7,760 | $29,560 |
| 2015 | $1,081 | $37,134 | $7,600 | $29,534 |
| 2014 | $1,081 | $37,134 | $7,600 | $29,534 |
K
Seller's Agent in 2022
Kadie Stidham
Orchard Brokerage, LLC
G
Seller Co-Listing Agent in 2022
Genji Jones
Invitation Homes
L
Buyer's Agent in 2022
Lindsey Rundell
Keller Williams Realty Atl. Partners
Seller's Agent in 2018
Michelle Hewell
Keller Williams Realty Atlanta Partners
(404) 328-6034
42 Total Sales
Seller's Agent in 2018
Bell Real Estate Group
Keller Williams Realty Atlanta Partners
(678) 207-1542
427 Total Sales
Seller Co-Listing Agent in 2018
Jacob Moran
Keller Williams Realty Atlanta Partners
(770) 530-8839
77 Total Sales
Source: First Multiple Listing Service (FMLS)
MLS Number: 5968189
APN: 15-0043F-00-078
Disclaimer: Certain information contained herein is derived from information provided by parties other than Homes.com. All information provided is deemed reliable, but is not guaranteed to be accurate and should be independently verified.
![]() Listings identified with the FMLS IDX logo come from FMLS and are held by brokerage firms other than the owner of this website. The listing brokerage is identified in any listing details. Information is deemed reliable but is not guaranteed. If you believe any FMLS listing contains material that infringes your copyrighted work please visit www.fmls.com/dmca to review our DMCA policy and learn how to submit a takedown request. © 2025 First Multiple Listing Service, Inc.
Listings identified with the FMLS IDX logo come from FMLS and are held by brokerage firms other than the owner of this website. The listing brokerage is identified in any listing details. Information is deemed reliable but is not guaranteed. If you believe any FMLS listing contains material that infringes your copyrighted work please visit www.fmls.com/dmca to review our DMCA policy and learn how to submit a takedown request. © 2025 First Multiple Listing Service, Inc.