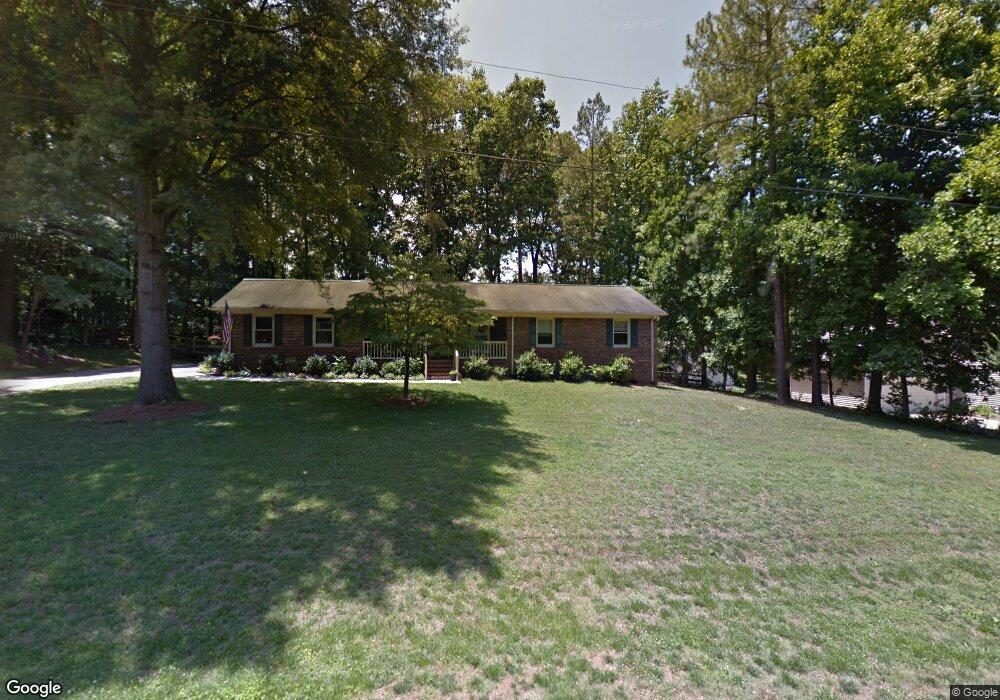
5318 Historic Springs Dr Concord, NC 28025
Estimated Value: $299,000 - $374,000
3
Beds
2
Baths
1,356
Sq Ft
$243/Sq Ft
Est. Value
About This Home
This home is located at 5318 Historic Springs Dr, Concord, NC 28025 and is currently estimated at $329,088, approximately $242 per square foot. 5318 Historic Springs Dr is a home located in Cabarrus County with nearby schools including A.T. Allen Elementary School, Mount Pleasant Middle School, and Mount Pleasant High School.
Ownership History
Date
Name
Owned For
Owner Type
Purchase Details
Closed on
Jan 15, 2025
Sold by
Hajney John P and Hajney Sandra J
Bought by
Mcneill Franklin Purcell and Mcneill Alyssa Marie
Current Estimated Value
Home Financials for this Owner
Home Financials are based on the most recent Mortgage that was taken out on this home.
Original Mortgage
$285,000
Outstanding Balance
$282,975
Interest Rate
6.69%
Mortgage Type
New Conventional
Estimated Equity
$46,113
Purchase Details
Closed on
Mar 1, 1997
Bought by
Hajney John P and Wife Sandra J
Purchase Details
Closed on
Nov 1, 1989
Purchase Details
Closed on
Dec 1, 1988
Purchase Details
Closed on
Apr 1, 1985
Create a Home Valuation Report for This Property
The Home Valuation Report is an in-depth analysis detailing your home's value as well as a comparison with similar homes in the area
Home Values in the Area
Average Home Value in this Area
Purchase History
| Date | Buyer | Sale Price | Title Company |
|---|---|---|---|
| Mcneill Franklin Purcell | $305,000 | None Listed On Document | |
| Mcneill Franklin Purcell | $305,000 | None Listed On Document | |
| Hajney John P | $110,000 | -- | |
| -- | $81,000 | -- | |
| -- | $75,500 | -- | |
| -- | $9,000 | -- |
Source: Public Records
Mortgage History
| Date | Status | Borrower | Loan Amount |
|---|---|---|---|
| Open | Mcneill Franklin Purcell | $285,000 | |
| Closed | Mcneill Franklin Purcell | $285,000 |
Source: Public Records
Tax History Compared to Growth
Tax History
| Year | Tax Paid | Tax Assessment Tax Assessment Total Assessment is a certain percentage of the fair market value that is determined by local assessors to be the total taxable value of land and additions on the property. | Land | Improvement |
|---|---|---|---|---|
| 2025 | $2,418 | $352,410 | $91,000 | $261,410 |
| 2024 | $2,418 | $352,410 | $91,000 | $261,410 |
| 2023 | $1,653 | $192,650 | $42,000 | $150,650 |
| 2022 | $1,653 | $192,650 | $42,000 | $150,650 |
| 2021 | $1,653 | $192,650 | $42,000 | $150,650 |
| 2020 | $1,653 | $192,650 | $42,000 | $150,650 |
| 2019 | $1,312 | $152,940 | $38,000 | $114,940 |
| 2018 | $1,259 | $152,940 | $38,000 | $114,940 |
| 2017 | $1,214 | $151,210 | $38,000 | $113,210 |
| 2016 | $1,214 | $137,420 | $38,000 | $99,420 |
| 2015 | $1,076 | $137,420 | $38,000 | $99,420 |
| 2014 | $1,076 | $137,420 | $38,000 | $99,420 |
Source: Public Records
Map
Nearby Homes
- 2909 Arbor Knoll
- 3109 Fairmead Dr
- 5200 Fieldstone Dr
- 3261 Fairmead Dr
- 1930 Cold Springs Rd
- 1665 Red Bird Cir
- 1695 Lemming Dr
- 4641 Yellow Poplar Ln
- 4615 Yellow Poplar Ln
- 4957 Phoenix Cir
- 1300 Hess Rd
- 2370 Mount Pleasant Rd S
- 5650 Miami Church Rd
- 3350 Miami Church Rd
- 5306 Club View Dr
- 622 Brennan St Unit 39
- 614 Brennan St Unit 38
- 606 Brennan St Unit 37
- 2314 Fairport Dr SE
- 2365 Baxter Place SE
- 5400 Historic Springs Dr
- 5312 Historic Springs Dr
- 5331 Fieldstone Dr
- 5341 Fieldstone Dr
- 5321 Fieldstone Dr
- 5339 Historic Springs Dr
- 5313 Historic Springs Dr
- 5406 Historic Springs Dr
- 5311 Fieldstone Dr
- 5401 Historic Springs Dr
- 3000 Fairmead Dr
- 5301 Fieldstone Dr
- 5307 Historic Springs Dr
- 5407 Historic Springs Dr
- 2730 Byfield Dr
- 5412 Historic Springs Dr
- 5340 Fieldstone Dr
- 2901 Arbor Knoll
- 2731 Byfield Dr
- 2738 Byfield Dr