Estimated Value: $313,000 - $347,000
4
Beds
3
Baths
1,874
Sq Ft
$174/Sq Ft
Est. Value
About This Home
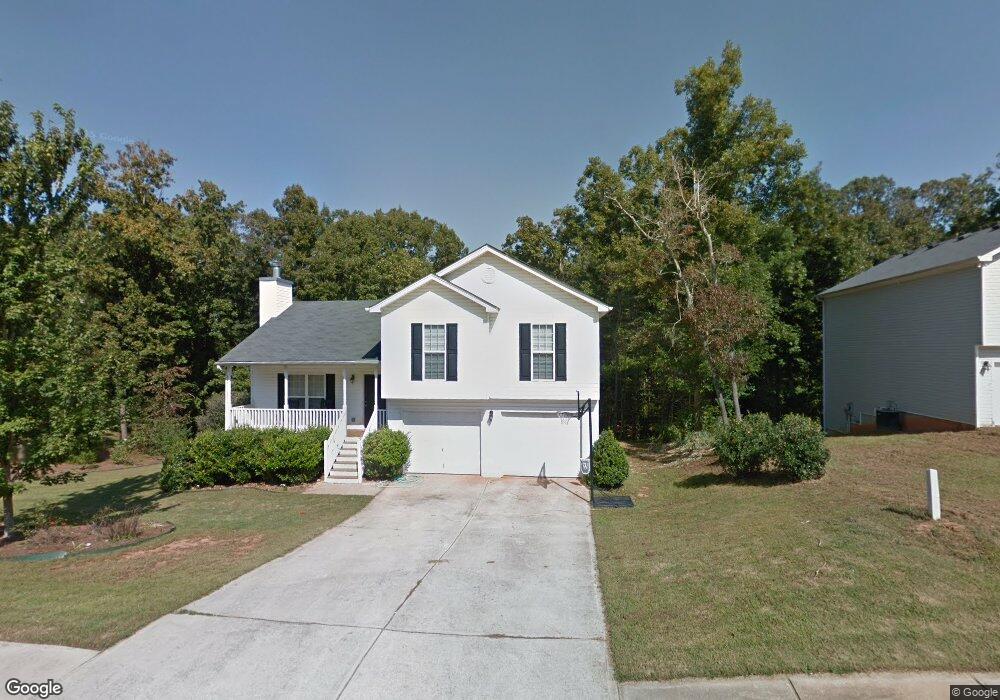
This home is located at 5318 Misty Meadow Dr Unit 76, Lula, GA 30554 and is currently estimated at $326,436, approximately $174 per square foot. 5318 Misty Meadow Dr Unit 76 is a home located in Hall County with nearby schools including Lula Elementary School, East Hall Middle School, and East Hall High School.
Ownership History
Date
Name
Owned For
Owner Type
Purchase Details
Closed on
May 25, 2022
Sold by
Dale Benjamin M
Bought by
Dale Benjamin M and Dale Jessica Marie
Current Estimated Value
Home Financials for this Owner
Home Financials are based on the most recent Mortgage that was taken out on this home.
Original Mortgage
$168,000
Interest Rate
5.09%
Mortgage Type
New Conventional
Purchase Details
Closed on
Jun 29, 2017
Sold by
21St Mtg Corp
Bought by
Dale Benjamin M
Home Financials for this Owner
Home Financials are based on the most recent Mortgage that was taken out on this home.
Original Mortgage
$149,737
Interest Rate
3.75%
Mortgage Type
FHA
Purchase Details
Closed on
Oct 4, 2016
Sold by
Jeffrey R
Bought by
21St Mtg Corp
Purchase Details
Closed on
Feb 24, 2006
Sold by
Dac Enterprises Inc
Bought by
Southfork Homes Inc
Create a Home Valuation Report for This Property
The Home Valuation Report is an in-depth analysis detailing your home's value as well as a comparison with similar homes in the area
Home Values in the Area
Average Home Value in this Area
Purchase History
| Date | Buyer | Sale Price | Title Company |
|---|---|---|---|
| Dale Benjamin M | -- | -- | |
| Dale Benjamin M | $152,500 | -- | |
| 21St Mtg Corp | $115,000 | -- | |
| Southfork Homes Inc | $1,050,000 | -- |
Source: Public Records
Mortgage History
| Date | Status | Borrower | Loan Amount |
|---|---|---|---|
| Previous Owner | Dale Benjamin M | $168,000 | |
| Previous Owner | Dale Benjamin M | $149,737 |
Source: Public Records
Tax History Compared to Growth
Tax History
| Year | Tax Paid | Tax Assessment Tax Assessment Total Assessment is a certain percentage of the fair market value that is determined by local assessors to be the total taxable value of land and additions on the property. | Land | Improvement |
|---|---|---|---|---|
| 2025 | $2,951 | $122,400 | $18,600 | $103,800 |
| 2024 | $3,109 | $123,880 | $18,600 | $105,280 |
| 2023 | $2,970 | $118,360 | $18,600 | $99,760 |
| 2022 | $2,443 | $93,440 | $13,360 | $80,080 |
| 2021 | $2,212 | $83,040 | $13,360 | $69,680 |
| 2020 | $1,912 | $69,720 | $6,040 | $63,680 |
| 2019 | $1,966 | $71,080 | $9,120 | $61,960 |
| 2018 | $1,743 | $63,520 | $9,120 | $54,400 |
| 2017 | $1,695 | $57,880 | $9,120 | $48,760 |
| 2016 | $1,734 | $60,640 | $7,040 | $53,600 |
| 2015 | $1,362 | $47,268 | $6,280 | $40,988 |
| 2014 | $1,362 | $47,268 | $6,280 | $40,988 |
Source: Public Records
Map
Nearby Homes
- 5343 Misty Meadow Dr
- 5794 Julian Baugh Rd
- 5343 Morgan Manor Dr
- 5691 Woodlin Rd
- 4938 Old Cornelia Hwy
- 4920 Cagle Mill Rd
- 4193 Cagle Rd
- 4969 Cagle Rd
- 5609 Oconee St
- 5563 Pine St
- 5498 Woodlin Rd
- 6334 Pine Ridge Point
- 6385 Pine Station Dr
- 6041 Cobb St
- 6108 Carter St
- 4519 Roy Cagle Rd
- 5867 Main St
- 6253 Main St
- 7123 W County Line Rd
- 6258 Southern Magnolia Ln
- 5318 Misty Meadow Dr
- 5312 Misty Meadow Dr Unit 77
- 5312 Misty Meadow Dr
- 5324 Misty Meadow Dr
- 5313 Misty Meadow Dr
- 5306 Misty Meadow Dr
- 5319 Misty Meadow Dr Unit 67
- 5319 Misty Meadow Dr
- 5304 Crown Oaks Dr
- 5330 Misty Meadow Dr
- 5325 Misty Meadow Dr
- 5331 Misty Meadow Dr
- 5302 Misty Meadow Dr
- 5336 Misty Meadow Dr
- 5797 Riley Farm Rd
- 5792 Riley Farm Rd
- 5303 Crown Oaks Dr
- 5337 Misty Meadow Dr
- 5793 Riley Farm Rd
- 5342 Misty Meadow Dr