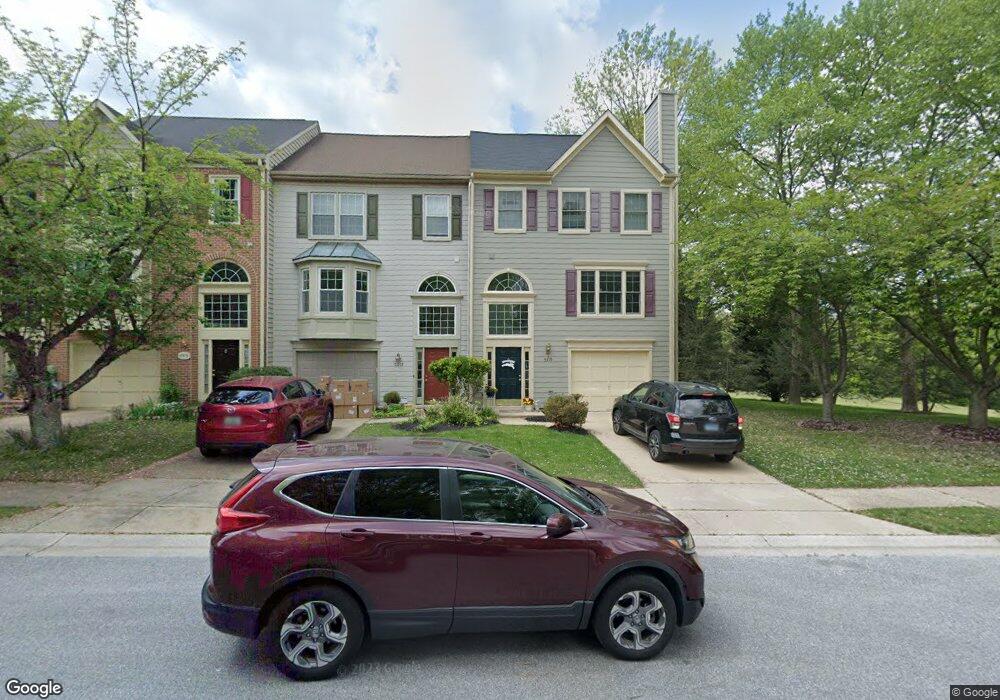
5319 Butler Ct Columbia, MD 21044
Fairway Hills NeighborhoodEstimated Value: $545,000 - $569,000
--
Bed
4
Baths
2,198
Sq Ft
$254/Sq Ft
Est. Value
About This Home
This home is located at 5319 Butler Ct, Columbia, MD 21044 and is currently estimated at $558,800, approximately $254 per square foot. 5319 Butler Ct is a home located in Howard County with nearby schools including Running Brook Elementary School, Wilde Lake Middle, and Wilde Lake High.
Ownership History
Date
Name
Owned For
Owner Type
Purchase Details
Closed on
May 1, 2024
Sold by
Klebanow Kenneth M and Herrick Susan E
Bought by
Kenneth M Klebanow Revocable Trust and Susan E Herrick Revocable Trust
Current Estimated Value
Purchase Details
Closed on
Mar 17, 2005
Sold by
James Dolphin
Bought by
Klebanow Kenneth M and Herrick Susan E
Purchase Details
Closed on
Mar 15, 2005
Sold by
Dolphin James
Bought by
Klebanow Kenneth M and Herrick Susan E
Purchase Details
Closed on
Sep 4, 2001
Sold by
Kennedy Oliver C
Bought by
Dolphin James
Purchase Details
Closed on
Oct 27, 1997
Sold by
Phillips Gregory B
Bought by
Kennedy Oliver C
Purchase Details
Closed on
Oct 18, 1993
Sold by
Trafalgar House Prop
Bought by
Phillips Gregory B
Home Financials for this Owner
Home Financials are based on the most recent Mortgage that was taken out on this home.
Original Mortgage
$160,000
Interest Rate
6.87%
Create a Home Valuation Report for This Property
The Home Valuation Report is an in-depth analysis detailing your home's value as well as a comparison with similar homes in the area
Home Values in the Area
Average Home Value in this Area
Purchase History
| Date | Buyer | Sale Price | Title Company |
|---|---|---|---|
| Kenneth M Klebanow Revocable Trust | -- | None Listed On Document | |
| Klebanow Kenneth M | $380,000 | -- | |
| Klebanow Kenneth M | $380,000 | -- | |
| Dolphin James | $249,900 | -- | |
| Kennedy Oliver C | $199,900 | -- | |
| Phillips Gregory B | $168,502 | -- |
Source: Public Records
Mortgage History
| Date | Status | Borrower | Loan Amount |
|---|---|---|---|
| Previous Owner | Phillips Gregory B | $160,000 | |
| Closed | Kennedy Oliver C | -- |
Source: Public Records
Tax History Compared to Growth
Tax History
| Year | Tax Paid | Tax Assessment Tax Assessment Total Assessment is a certain percentage of the fair market value that is determined by local assessors to be the total taxable value of land and additions on the property. | Land | Improvement |
|---|---|---|---|---|
| 2025 | $6,061 | $442,267 | $0 | $0 |
| 2024 | $6,061 | $417,900 | $170,000 | $247,900 |
| 2023 | $5,778 | $390,267 | $0 | $0 |
| 2022 | $5,466 | $362,633 | $0 | $0 |
| 2021 | $5,205 | $335,000 | $120,000 | $215,000 |
| 2020 | $5,205 | $335,000 | $120,000 | $215,000 |
| 2019 | $5,205 | $335,000 | $120,000 | $215,000 |
| 2018 | $5,095 | $347,600 | $125,900 | $221,700 |
| 2017 | $5,020 | $347,600 | $0 | $0 |
| 2016 | $1,135 | $339,333 | $0 | $0 |
| 2015 | $1,135 | $335,200 | $0 | $0 |
| 2014 | $1,108 | $331,333 | $0 | $0 |
Source: Public Records
Map
Nearby Homes
- 5349 Chase Lions Way
- 4934 Columbia Rd
- 5646 April Journey
- 5522 April Journey
- 5505 April Journey
- 4942 Columbia Rd
- 5065 Columbia Rd
- 9440 Dartmouth Rd
- 4723 Leyden Way
- 4777 Leyden Way
- 5134 W Running Brook Rd
- 5390 Smooth Meadow Way Unit 2
- 5378 Smooth Meadow Way Unit 2
- 5423 Smooth Meadow Way
- 5241 W Running Brook Rd
- 5234 W Running Brook Rd
- 5233 Hayledge Ct
- 4770 Dorsey Hall Dr Unit 2
- 4750 Dorsey Hall Dr Unit 4
- 5491 Vantage Point Rd
- 5317 Butler Ct
- 5315 Butler Ct
- 5313 Butler Ct
- 5356 Tarkington Place
- 5326 Butler Ct
- 5358 Tarkington Place
- 5324 Butler Ct
- 5360 Tarkington Place
- 5322 Butler Ct
- 5320 Butler Ct
- 5309 Butler Ct
- 5362 Tarkington Place
- 5307 Butler Ct
- 5318 Butler Ct
- 5364 Tarkington Place
- 5305 Butler Ct
- 5303 Butler Ct
- 5366 Tarkington Place
- 5301 Butler Ct
- 5314 Butler Ct