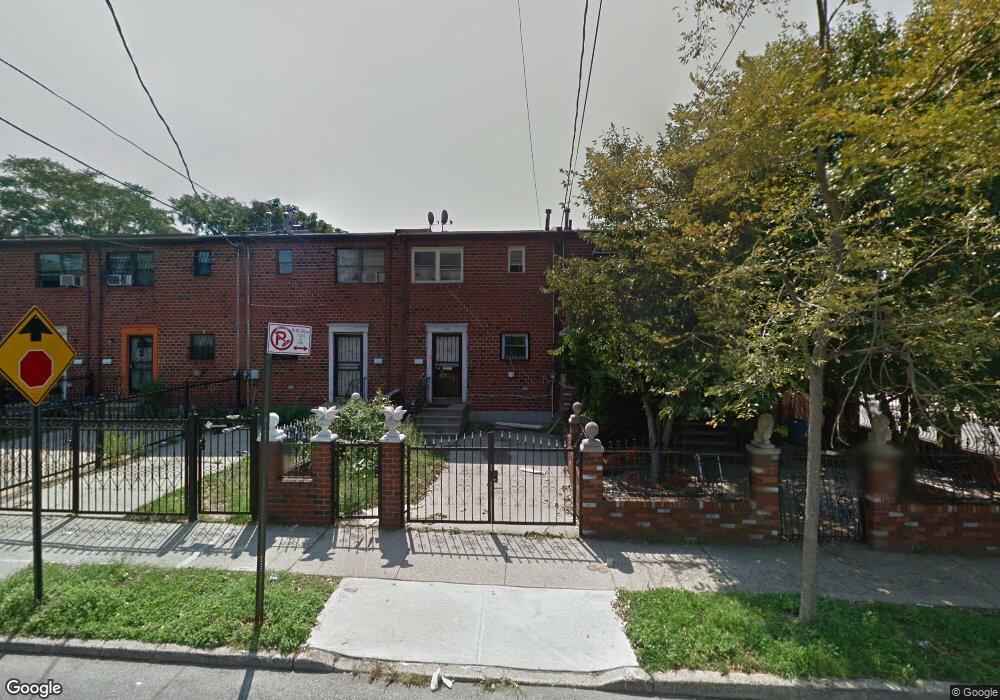
532 Belmont Ave Brooklyn, NY 11207
East New York NeighborhoodEstimated Value: $604,000 - $668,000
Studio
--
Bath
1,132
Sq Ft
$557/Sq Ft
Est. Value
About This Home
This home is located at 532 Belmont Ave, Brooklyn, NY 11207 and is currently estimated at $629,968, approximately $556 per square foot. 532 Belmont Ave is a home located in Kings County with nearby schools including P.S. 158 Warwick, J.H.S 292 Margaret S. Douglas, and Salve Regina Catholic Academy.
Ownership History
Date
Name
Owned For
Owner Type
Purchase Details
Closed on
Mar 23, 2006
Sold by
Small Roland
Bought by
Sawyers Lydia
Current Estimated Value
Home Financials for this Owner
Home Financials are based on the most recent Mortgage that was taken out on this home.
Original Mortgage
$70,000
Outstanding Balance
$39,345
Interest Rate
6.27%
Estimated Equity
$590,623
Purchase Details
Closed on
Mar 3, 2006
Sold by
Allen Carl
Bought by
Small Roland
Home Financials for this Owner
Home Financials are based on the most recent Mortgage that was taken out on this home.
Original Mortgage
$70,000
Outstanding Balance
$39,345
Interest Rate
6.27%
Estimated Equity
$590,623
Purchase Details
Closed on
Aug 10, 2005
Sold by
Sawyers Lydia
Bought by
Allen Carl
Home Financials for this Owner
Home Financials are based on the most recent Mortgage that was taken out on this home.
Original Mortgage
$217,000
Interest Rate
5.68%
Mortgage Type
Purchase Money Mortgage
Create a Home Valuation Report for This Property
The Home Valuation Report is an in-depth analysis detailing your home's value as well as a comparison with similar homes in the area
Home Values in the Area
Average Home Value in this Area
Purchase History
| Date | Buyer | Sale Price | Title Company |
|---|---|---|---|
| Sawyers Lydia | -- | -- | |
| Sawyers Lydia | -- | -- | |
| Small Roland | $350,000 | -- | |
| Small Roland | $350,000 | -- | |
| Allen Carl | $310,000 | -- | |
| Allen Carl | $310,000 | -- |
Source: Public Records
Mortgage History
| Date | Status | Borrower | Loan Amount |
|---|---|---|---|
| Open | Small Roland | $70,000 | |
| Closed | Small Roland | $70,000 | |
| Open | Small Roland | $280,000 | |
| Closed | Small Roland | $280,000 | |
| Previous Owner | Allen Carl | $217,000 |
Source: Public Records
Tax History
| Year | Tax Paid | Tax Assessment Tax Assessment Total Assessment is a certain percentage of the fair market value that is determined by local assessors to be the total taxable value of land and additions on the property. | Land | Improvement |
|---|---|---|---|---|
| 2025 | $4,025 | $35,100 | $11,160 | $23,940 |
| 2024 | $4,025 | $27,720 | $11,160 | $16,560 |
| 2023 | $3,840 | $31,680 | $11,160 | $20,520 |
| 2022 | $3,706 | $28,740 | $11,160 | $17,580 |
| 2021 | $3,686 | $24,900 | $11,160 | $13,740 |
| 2020 | $3,686 | $25,740 | $11,160 | $14,580 |
| 2019 | $3,494 | $25,740 | $11,160 | $14,580 |
| 2018 | $3,212 | $15,758 | $9,131 | $6,627 |
| 2017 | $3,154 | $15,470 | $8,037 | $7,433 |
| 2016 | $2,918 | $14,596 | $7,182 | $7,414 |
| 2015 | $1,630 | $14,596 | $7,617 | $6,979 |
| 2014 | $1,630 | $13,919 | $7,491 | $6,428 |
Source: Public Records
Map
Nearby Homes
- 530 Belmont Ave
- 534 Belmont Ave
- 536 Belmont Ave
- 538 Belmont Ave
- 355 van Siclen Ave Unit 5
- 540 Belmont Ave
- 359 van Siclen Ave
- 546 Belmont Ave
- 361 van Siclen Ave
- 548 Belmont Ave Unit 550
- 548-550 Belmont Ave
- 348 van Siclen Ave
- 350 van Siclen Ave
- 432 Hendrix St
- 352 van Siclen Ave
- 354 van Siclen Ave
- 335 van Siclen Ave
- 552 Belmont Ave
- 356 van Siclen Ave
- 436 Hendrix St
Your Personal Tour Guide
Ask me questions while you tour the home.