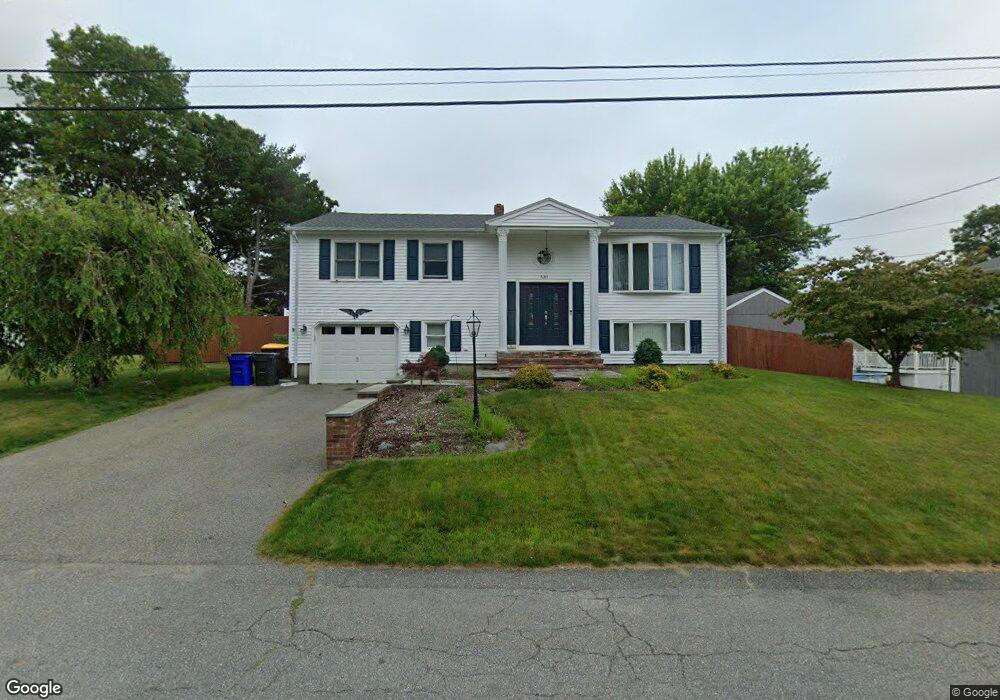
532 Bullock St Fall River, MA 02720
Bank Street NeighborhoodEstimated Value: $506,083 - $521,000
3
Beds
2
Baths
1,868
Sq Ft
$276/Sq Ft
Est. Value
About This Home
This home is located at 532 Bullock St, Fall River, MA 02720 and is currently estimated at $515,521, approximately $275 per square foot. 532 Bullock St is a home located in Bristol County with nearby schools including Mary Fonseca Elementary School, Talbot Innovation School, and B M C Durfee High School.
Ownership History
Date
Name
Owned For
Owner Type
Purchase Details
Closed on
Sep 11, 2006
Sold by
Brown Dawn M and Brown Douglas
Bought by
Nowacki Quentin and Nowacki Stephanie
Current Estimated Value
Purchase Details
Closed on
May 25, 2004
Sold by
Silvia John M Jr Est
Bought by
Brown Dawn M
Home Financials for this Owner
Home Financials are based on the most recent Mortgage that was taken out on this home.
Original Mortgage
$160,000
Interest Rate
5.75%
Mortgage Type
Purchase Money Mortgage
Create a Home Valuation Report for This Property
The Home Valuation Report is an in-depth analysis detailing your home's value as well as a comparison with similar homes in the area
Home Values in the Area
Average Home Value in this Area
Purchase History
| Date | Buyer | Sale Price | Title Company |
|---|---|---|---|
| Nowacki Quentin | $322,500 | -- | |
| Brown Dawn M | $200,000 | -- |
Source: Public Records
Mortgage History
| Date | Status | Borrower | Loan Amount |
|---|---|---|---|
| Previous Owner | Brown Dawn M | $20,000 | |
| Previous Owner | Brown Dawn M | $160,000 |
Source: Public Records
Tax History
| Year | Tax Paid | Tax Assessment Tax Assessment Total Assessment is a certain percentage of the fair market value that is determined by local assessors to be the total taxable value of land and additions on the property. | Land | Improvement |
|---|---|---|---|---|
| 2025 | $4,839 | $422,600 | $137,700 | $284,900 |
| 2024 | $4,343 | $378,000 | $132,500 | $245,500 |
| 2023 | $4,247 | $346,100 | $118,900 | $227,200 |
| 2022 | $3,738 | $296,200 | $110,100 | $186,100 |
| 2021 | $3,798 | $274,600 | $104,000 | $170,600 |
| 2020 | $3,766 | $260,600 | $100,100 | $160,500 |
| 2019 | $3,800 | $260,600 | $100,100 | $160,500 |
| 2018 | $3,579 | $244,800 | $100,100 | $144,700 |
| 2017 | $3,354 | $239,600 | $100,100 | $139,500 |
| 2016 | $3,039 | $223,000 | $100,100 | $122,900 |
| 2015 | $2,870 | $219,400 | $93,600 | $125,800 |
| 2014 | $2,760 | $219,400 | $93,600 | $125,800 |
Source: Public Records
Map
Nearby Homes
Your Personal Tour Guide
Ask me questions while you tour the home.