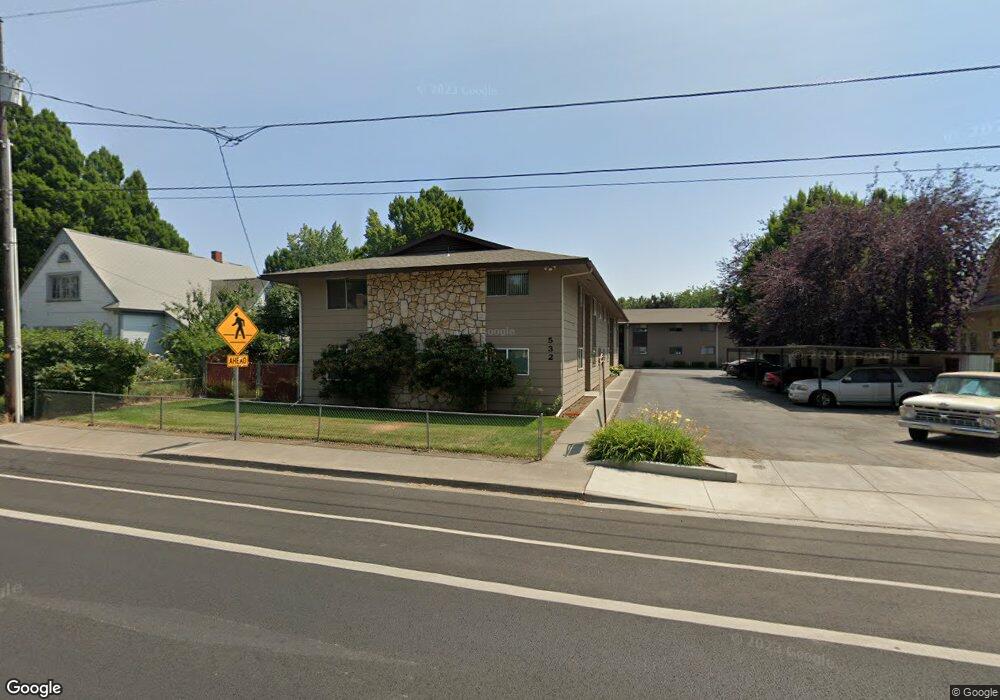
532 E Alder St Unit 3 Walla Walla, WA 99362
Estimated Value: $146,000 - $204,000
2
Beds
1
Bath
808
Sq Ft
$210/Sq Ft
Est. Value
About This Home
This home is located at 532 E Alder St Unit 3, Walla Walla, WA 99362 and is currently estimated at $169,942, approximately $210 per square foot. 532 E Alder St Unit 3 is a home located in Walla Walla County with nearby schools including Sharpstein Elementary School, Garrison Middle School, and Willow Public School.
Ownership History
Date
Name
Owned For
Owner Type
Purchase Details
Closed on
Sep 16, 2024
Sold by
George & Kathy Holland Family Trust and Holland George
Bought by
Holland George F and Escobin-Holland Marianne Tp
Current Estimated Value
Home Financials for this Owner
Home Financials are based on the most recent Mortgage that was taken out on this home.
Original Mortgage
$93,000
Outstanding Balance
$87,647
Interest Rate
5.05%
Mortgage Type
New Conventional
Estimated Equity
$82,295
Purchase Details
Closed on
Aug 22, 2012
Sold by
Bechtold Thomas and Bechtold Karen
Bought by
Holland Ii George Francis and Holland Kathleen
Purchase Details
Closed on
Mar 30, 2006
Sold by
Botimer David L and Botimer Linda S
Bought by
Bechtold Thomas and Bechtold Karen
Home Financials for this Owner
Home Financials are based on the most recent Mortgage that was taken out on this home.
Original Mortgage
$66,025
Interest Rate
6.25%
Mortgage Type
New Conventional
Create a Home Valuation Report for This Property
The Home Valuation Report is an in-depth analysis detailing your home's value as well as a comparison with similar homes in the area
Purchase History
| Date | Buyer | Sale Price | Title Company |
|---|---|---|---|
| Holland George F | $140,000 | Titleone | |
| Holland Ii George Francis | $72,500 | Land Title Of Walla Walla Co | |
| Bechtold Thomas | $69,500 | Land Title Of Walla Walla Co |
Source: Public Records
Mortgage History
| Date | Status | Borrower | Loan Amount |
|---|---|---|---|
| Open | Holland George F | $93,000 | |
| Previous Owner | Bechtold Thomas | $66,025 |
Source: Public Records
Tax History
| Year | Tax Paid | Tax Assessment Tax Assessment Total Assessment is a certain percentage of the fair market value that is determined by local assessors to be the total taxable value of land and additions on the property. | Land | Improvement |
|---|---|---|---|---|
| 2025 | $1,391 | $140,500 | -- | $140,500 |
| 2024 | $1,186 | $140,500 | -- | $140,500 |
| 2023 | $1,186 | $133,870 | $0 | $133,870 |
| 2022 | $1,177 | $111,560 | $0 | $111,560 |
| 2021 | $928 | $108,630 | $0 | $108,630 |
| 2020 | $917 | $77,600 | $0 | $77,600 |
| 2019 | $799 | $77,600 | $0 | $77,600 |
| 2018 | $890 | $73,900 | $0 | $73,900 |
| 2017 | $660 | $67,430 | $0 | $67,430 |
| 2016 | $694 | $53,950 | $0 | $53,950 |
| 2015 | $838 | $53,950 | $0 | $53,950 |
| 2014 | -- | $66,600 | $0 | $66,600 |
| 2013 | -- | $66,600 | $0 | $66,600 |
Source: Public Records
Map
Nearby Homes
- 444 Washington St
- 421 Crescent St
- 531 Newell St
- 309 E Birch St
- 114 S Madison St
- 366 S Palouse St
- 58 S Madison St
- 229 Newell St
- 713 Whitman St
- 630 Francis Ave
- 600 Craig St
- 364 Catherine St Unit S10
- 130 Dice Place
- 609 Pleasant St
- 830 Boyer Ave
- 124 Whitman St
- 995 Hobson St
- 605 S Division St
- 724 Valencia St
- 1055 E E Isaacs Ave E
- 532 E Alder St Unit 2
- 532 E Alder St Unit 12
- 532 E Alder St Unit 11
- 532 E Alder St Unit 10
- 532 E Alder St Unit 9
- 532 E Alder St Unit 8
- 532 E Alder St Unit 7
- 532 E Alder St Unit 6
- 532 E Alder St Unit 5
- 532 E Alder St Unit 4
- 532 E Alder St Unit 20
- 532 E Alder St Unit 19
- 532 E Alder St Unit 18
- 532 E Alder St Unit 17
- 532 E Alder St Unit 16
- 532 E Alder St Unit 15
- 532 E Alder St Unit 14
- 532 E Alder St Unit 1
- 532 E Alder St
- 333 Grove St Unit 24
Your Personal Tour Guide
Ask me questions while you tour the home.