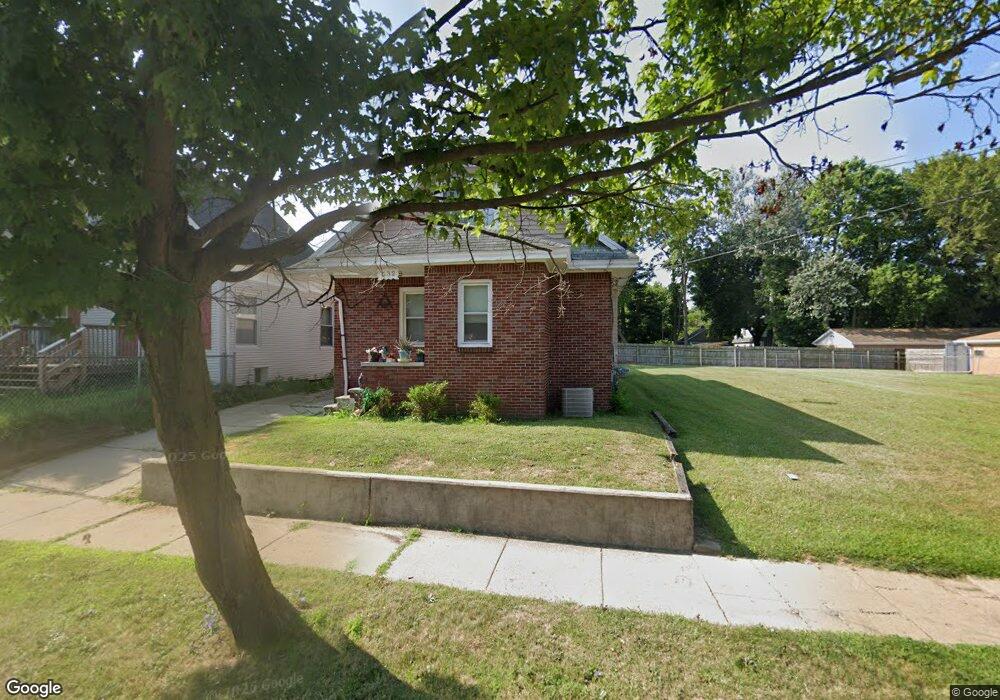
532 E Mt Hope Lansing, MI 48910
Clifford Park NeighborhoodEstimated Value: $112,000 - $141,400
3
Beds
1
Bath
1,135
Sq Ft
$108/Sq Ft
Est. Value
About This Home
This home is located at 532 E Mt Hope, Lansing, MI 48910 and is currently estimated at $122,850, approximately $108 per square foot. 532 E Mt Hope is a home located in Ingham County with nearby schools including Lyons Elementary School, Attwood School, and Eastern High School.
Ownership History
Date
Name
Owned For
Owner Type
Purchase Details
Closed on
Feb 24, 2014
Sold by
Allen Lykesha L and Allen Homer Lee
Bought by
Sanchez Jose G and Guzman Rocio R
Current Estimated Value
Purchase Details
Closed on
Apr 22, 2010
Sold by
Allen Lykesha C
Bought by
Allen Lykesha C and Allen Homer Lee
Purchase Details
Closed on
Jun 1, 2001
Sold by
Va
Bought by
Rockafellow Rex A
Home Financials for this Owner
Home Financials are based on the most recent Mortgage that was taken out on this home.
Original Mortgage
$53,067
Interest Rate
7.2%
Mortgage Type
FHA
Purchase Details
Closed on
May 11, 2001
Sold by
Rockafellow Rex A and Rockafellow Pricilla A
Bought by
Crenshaw Lykesha
Home Financials for this Owner
Home Financials are based on the most recent Mortgage that was taken out on this home.
Original Mortgage
$53,067
Interest Rate
7.2%
Mortgage Type
FHA
Purchase Details
Closed on
Mar 2, 1980
Bought by
Rockafellow Rex A
Create a Home Valuation Report for This Property
The Home Valuation Report is an in-depth analysis detailing your home's value as well as a comparison with similar homes in the area
Home Values in the Area
Average Home Value in this Area
Purchase History
| Date | Buyer | Sale Price | Title Company |
|---|---|---|---|
| Sanchez Jose G | $23,900 | Midstate Title Agency Llc | |
| Allen Lykesha C | -- | None Available | |
| Rockafellow Rex A | -- | Bell Title | |
| Crenshaw Lykesha | $53,900 | -- | |
| Rockafellow Rex A | -- | -- |
Source: Public Records
Mortgage History
| Date | Status | Borrower | Loan Amount |
|---|---|---|---|
| Previous Owner | Crenshaw Lykesha | $53,067 |
Source: Public Records
Tax History Compared to Growth
Tax History
| Year | Tax Paid | Tax Assessment Tax Assessment Total Assessment is a certain percentage of the fair market value that is determined by local assessors to be the total taxable value of land and additions on the property. | Land | Improvement |
|---|---|---|---|---|
| 2025 | $3,004 | $58,900 | $5,100 | $53,800 |
| 2024 | $25 | $53,200 | $5,100 | $48,100 |
| 2023 | $2,827 | $46,700 | $5,100 | $41,600 |
| 2022 | $2,581 | $41,400 | $4,700 | $36,700 |
| 2021 | $2,521 | $39,400 | $3,100 | $36,300 |
| 2020 | $2,503 | $38,400 | $3,100 | $35,300 |
| 2019 | $2,476 | $33,300 | $3,100 | $30,200 |
| 2018 | $2,293 | $30,500 | $3,100 | $27,400 |
| 2017 | $2,207 | $30,500 | $3,100 | $27,400 |
| 2016 | $1,634 | $30,000 | $3,100 | $26,900 |
| 2015 | $1,634 | $28,600 | $6,167 | $22,433 |
| 2014 | $1,634 | $28,600 | $4,797 | $23,803 |
Source: Public Records
Map
Nearby Homes
- 525 E Mount Hope Ave
- 1818 Ray St
- 1731 Herbert St
- 1800 Herbert St
- 520 Riley St
- 704 Mckim Ave
- 1927 Teel Ave
- 538 Pacific Ave
- 2107 Teel Ave
- 707 Isbell St
- 147 Isbell St
- 1539 Linval St
- 2208 Lyons Ave
- 531 Torrence Ct
- 2230 Maplewood Ave
- 601 Tisdale Ave
- 701 Tisdale Ave
- 1722 S Washington Ave
- 626 Tisdale Ave
- 918 Mckim Ave
- 532 E Mount Hope Ave
- 534 E Mount Hope Ave
- 528 E Mount Hope Ave
- 524 E Mount Hope Ave
- 544 E Mount Hope Ave
- 1918 Ray St
- 1911 Ray St
- 1920 Ray St
- 531 E Mount Hope Ave
- 533 E Mount Hope Ave
- 533 Florence St
- 548 E Mount Hope Ave
- 529 Florence St
- 1924 Ray St
- 527 Florence St
- 1919 Ray St
- 523 Florence St
- 1822 Ray St
- 1925 Ray St
- 519 Florence St