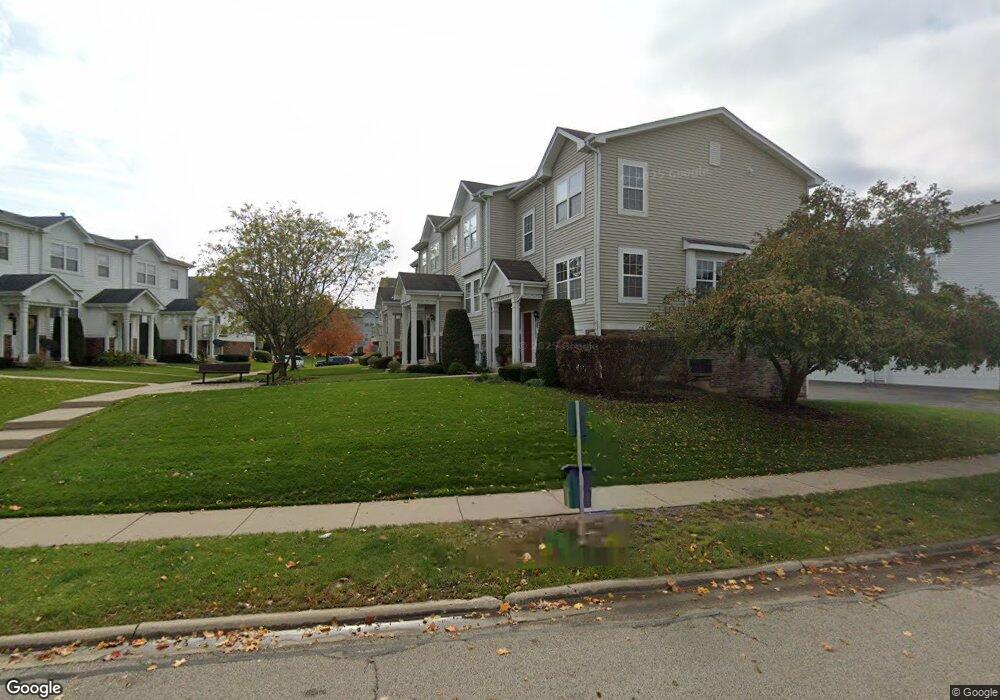
532 Holiday Ln Unit 682 Hainesville, IL 60073
Estimated Value: $234,000 - $247,000
2
Beds
2
Baths
1,792
Sq Ft
$133/Sq Ft
Est. Value
About This Home
This home is located at 532 Holiday Ln Unit 682, Hainesville, IL 60073 and is currently estimated at $239,224, approximately $133 per square foot. 532 Holiday Ln Unit 682 is a home located in Lake County with nearby schools including W.J. Murphy Elementary School, John T. Magee Middle School, and Round Lake High School.
Ownership History
Date
Name
Owned For
Owner Type
Purchase Details
Closed on
Oct 6, 2017
Sold by
Banina Russel W and Banina Russel W
Bought by
Cohen David and Cohen Lisa
Current Estimated Value
Purchase Details
Closed on
Sep 26, 2003
Sold by
Hosford Mark J and Hosford Sarah A
Bought by
Banina Russell W
Home Financials for this Owner
Home Financials are based on the most recent Mortgage that was taken out on this home.
Original Mortgage
$135,920
Interest Rate
5%
Mortgage Type
Purchase Money Mortgage
Purchase Details
Closed on
Apr 4, 2002
Sold by
The Hainesville Ltd Partnership Iii
Bought by
Hosford Mark J and Johnson Sarah A
Home Financials for this Owner
Home Financials are based on the most recent Mortgage that was taken out on this home.
Original Mortgage
$148,650
Interest Rate
7.13%
Create a Home Valuation Report for This Property
The Home Valuation Report is an in-depth analysis detailing your home's value as well as a comparison with similar homes in the area
Home Values in the Area
Average Home Value in this Area
Purchase History
| Date | Buyer | Sale Price | Title Company |
|---|---|---|---|
| Cohen David | $28,500 | Citywide Title Corp | |
| Banina Russell W | $170,000 | First American Title | |
| Hosford Mark J | $157,000 | First American Title |
Source: Public Records
Mortgage History
| Date | Status | Borrower | Loan Amount |
|---|---|---|---|
| Previous Owner | Banina Russell W | $135,920 | |
| Previous Owner | Hosford Mark J | $148,650 |
Source: Public Records
Tax History Compared to Growth
Tax History
| Year | Tax Paid | Tax Assessment Tax Assessment Total Assessment is a certain percentage of the fair market value that is determined by local assessors to be the total taxable value of land and additions on the property. | Land | Improvement |
|---|---|---|---|---|
| 2024 | $4,419 | $58,276 | $2,910 | $55,366 |
| 2023 | $4,329 | $53,484 | $2,671 | $50,813 |
| 2022 | $4,329 | $49,681 | $2,996 | $46,685 |
| 2021 | $4,593 | $47,752 | $2,880 | $44,872 |
| 2020 | $4,389 | $45,435 | $2,740 | $42,695 |
| 2019 | $4,271 | $43,591 | $2,629 | $40,962 |
| 2018 | $4,155 | $38,118 | $2,942 | $35,176 |
| 2017 | $4,086 | $35,855 | $2,767 | $33,088 |
| 2016 | $3,872 | $33,098 | $2,554 | $30,544 |
| 2015 | $3,741 | $30,237 | $2,333 | $27,904 |
| 2014 | $3,477 | $29,299 | $2,703 | $26,596 |
| 2012 | $3,512 | $30,600 | $2,823 | $27,777 |
Source: Public Records
Map
Nearby Homes
- 582 Holiday Ln Unit 472
- 284 Holiday Ln Unit 334
- 4 W Tall Oak Dr
- 304 E Willow Dr
- 448 N Patriot Dr Unit 705
- 319 Grandview Dr
- 121 Highmoor Dr
- 123 E Pineview Dr
- 375 N Tower Dr Unit 1202
- 606 N Triumph Ct Unit 236
- 91 W Big Horn Dr Unit 151
- 372 White Tail Dr
- 221 Kenwood Dr
- 113 E Big Horn Dr
- 408 Bellevue Dr
- 159 E Elk Ct
- 318 Kenwood Dr
- 34069 N Hainesville Rd
- 536 Arbor Dr
- 407 Greenwood Dr
- 531 Holiday Ln Unit 681
- 533 Holiday Ln Unit 683
- 534 Holiday Ln Unit 684
- 535 Holiday Ln Unit 685
- 515 Holiday Ln Unit 675
- 515 Holiday Ln
- 514 Holiday Ln Unit 674
- 536 Holiday Ln Unit 686
- 516 Holiday Ln Unit 676
- 513 Holiday Ln Unit 673
- 512 Holiday Ln Unit 672
- 631 Holiday Ln Unit 531
- 511 Holiday Ln Unit 671
- 632 Holiday Ln Unit 532
- 541 Holiday Ln Unit 451
- 633 Holiday Ln Unit 533
- 634 Holiday Ln Unit 534
- 634 Holiday Ln Unit 3
- 565 Holiday Ln Unit 465
- 542 Holiday Ln Unit 452