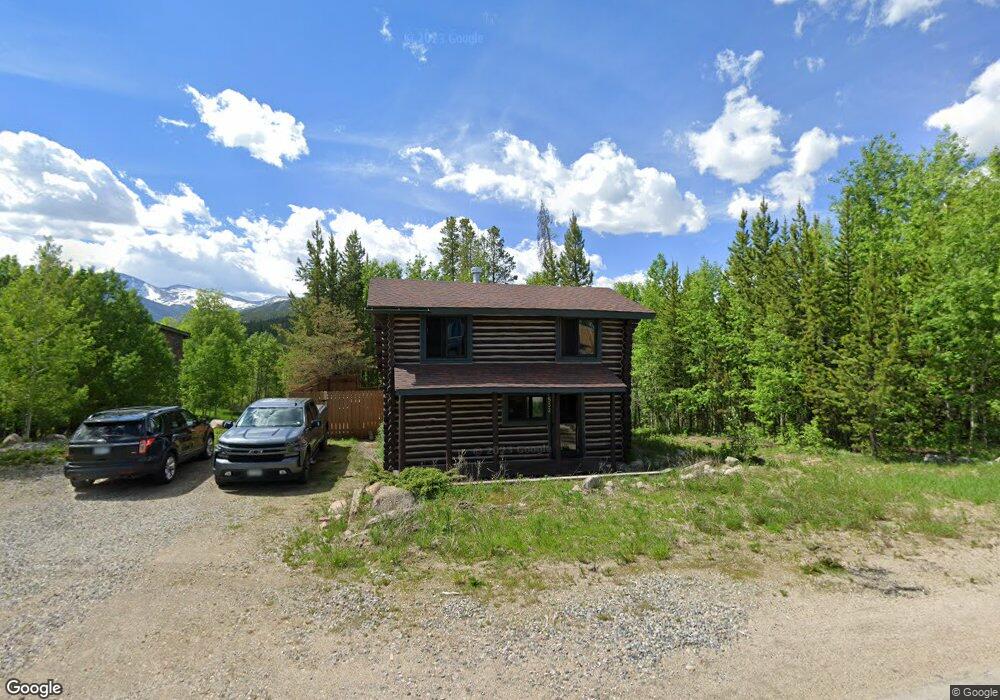
532 Kings Crossing Rd Winter Park, CO 80482
Estimated Value: $906,000 - $1,773,000
2
Beds
1
Bath
1,232
Sq Ft
$988/Sq Ft
Est. Value
About This Home
This home is located at 532 Kings Crossing Rd, Winter Park, CO 80482 and is currently estimated at $1,216,999, approximately $987 per square foot. 532 Kings Crossing Rd is a home located in Grand County with nearby schools including Middle Park High School.
Ownership History
Date
Name
Owned For
Owner Type
Purchase Details
Closed on
Mar 28, 2018
Sold by
Kings Crossing Llc
Bought by
Fish Lindsey and Chavez Robert
Current Estimated Value
Home Financials for this Owner
Home Financials are based on the most recent Mortgage that was taken out on this home.
Original Mortgage
$443,100
Outstanding Balance
$380,526
Interest Rate
4.38%
Mortgage Type
New Conventional
Estimated Equity
$836,473
Purchase Details
Closed on
Feb 22, 2017
Sold by
Mullens Richard S
Bought by
532 Kings Crossing Llc
Purchase Details
Closed on
Aug 19, 2005
Sold by
Wakehouse Craig R and Wakehouse Sherri R
Bought by
Mullens Richard S and Mullens Steven U
Home Financials for this Owner
Home Financials are based on the most recent Mortgage that was taken out on this home.
Original Mortgage
$43,500
Interest Rate
5.81%
Mortgage Type
Credit Line Revolving
Create a Home Valuation Report for This Property
The Home Valuation Report is an in-depth analysis detailing your home's value as well as a comparison with similar homes in the area
Home Values in the Area
Average Home Value in this Area
Purchase History
| Date | Buyer | Sale Price | Title Company |
|---|---|---|---|
| Fish Lindsey | $579,000 | Land Title Guaranty Company | |
| 532 Kings Crossing Llc | -- | None Available | |
| Mullens Richard S | $435,000 | Title Co Of The Rockies Inc |
Source: Public Records
Mortgage History
| Date | Status | Borrower | Loan Amount |
|---|---|---|---|
| Open | Fish Lindsey | $443,100 | |
| Previous Owner | Mullens Richard S | $43,500 | |
| Previous Owner | Mullens Richard S | $348,000 |
Source: Public Records
Tax History Compared to Growth
Tax History
| Year | Tax Paid | Tax Assessment Tax Assessment Total Assessment is a certain percentage of the fair market value that is determined by local assessors to be the total taxable value of land and additions on the property. | Land | Improvement |
|---|---|---|---|---|
| 2024 | $4,103 | $68,460 | $33,600 | $34,860 |
| 2023 | $4,103 | $68,460 | $33,600 | $34,860 |
| 2022 | $2,950 | $45,050 | $20,990 | $24,060 |
| 2021 | $2,947 | $46,340 | $21,590 | $24,750 |
| 2020 | $2,414 | $40,870 | $21,590 | $19,280 |
| 2019 | $2,357 | $40,870 | $21,590 | $19,280 |
| 2018 | $1,391 | $22,690 | $6,280 | $16,410 |
| 2017 | $1,702 | $22,610 | $6,280 | $16,330 |
| 2016 | $1,580 | $22,110 | $6,240 | $15,870 |
| 2015 | $1,522 | $22,110 | $6,240 | $15,870 |
| 2014 | $1,522 | $21,280 | $0 | $21,280 |
Source: Public Records
Map
Nearby Homes
- 510 Kings Crossing Rd Unit C 202
- 490 Kings Crossing Rd Unit 331
- 490 Kings Crossing Rd Unit 631-633
- 490 Kings Crossing Rd Unit 321
- 490 Kings Crossing Rd Unit 514
- 476 Kings Crossing Rd
- 145 Forest Trail Unit 9
- 185 Vasquez Rd Unit C4
- 185 Vasquez Rd Unit 2
- 185 Vasquez Rd Unit C1
- 185 Vasquez Rd Unit D1
- 185 Vasquez Rd Unit 5
- 185 Vasquez Rd Unit B1
- 185 Vasquez Rd
- 189 Pine Cone Ln
- 300 Kings Crossing Rd Unit B3
- 195 High Seasons Way Unit 1
- 579 Lake Trail
- 100 Arapahoe Rd
- 247 Lions Gate Dr
- 266 Forest Trail
- 539 Kings Crossing Rd
- 539 King's Crossing Rd
- 520 Kings Crossing Rd Unit 304
- 520 Kings Crossing Rd Unit 204
- 520 Kings Crossing Rd
- 520 Kings Crossing Rd Unit B101
- 520 Kings Crossing Rd Unit 202
- 520 King Crossing Rd
- 520 King Crossing Rd
- 520 King Crossing Rd
- 520 King Crossing Rd Unit A203
- 520 King Crossing Rd Unit 101
- 520 King Crossing Rd Unit 301
- 520 King Crossing Rd Unit 202
- 520 King Crossing Rd Unit 304
- 520 King Crossing Rd Unit 204
- 300 Forest Trail
- 101 Silverado I A-101
- 244 Forest Trail